
|
| Cloudmersive API Analytics |
| 11/17/2026 - Brian O'Neill |
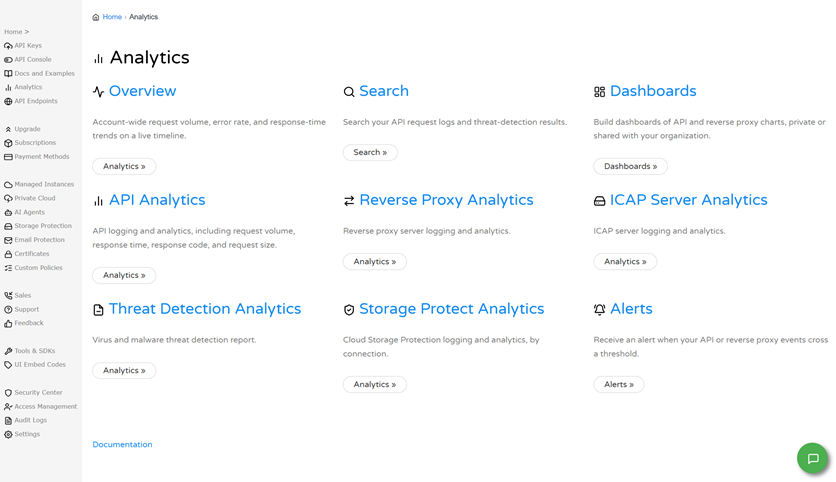
Overview of API AnalyticsAPI Analytics shows you how your Cloudmersive API calls are performing. Through the API Analytics page, you can see how many requests you’re sending, how quickly they’re answered, how many of those requests fail, and how large your requests are. You can also look at the individual requests behind those numbers. This article is intended to serve developers and administrators who use Cloudmersive APIs and want to monitor their usage. The API Analytics report has six tabs: Overview, Raw Logs, Request Volume Chart, Failed Request Volume Chart, Response Time Chart, and Request Size Chart. If you run a Private Cloud node, you can also view your analytics Overview for that node on its own through a tab on that node’s page. Overview of Cloudmersive AnalyticsAPI Analytics is a feature of Cloudmersive Analytics. Cloudmersive Analytics provides centralized logging and analytics across all your Cloudmersive services and deployments. From the Analytics page, you can reach areas for account-wide Overview, Search, Dashboards, API Analytics, Reverse Proxy Analytics, ICAP Server Analytics, Threat Detection Analytics, Storage Protect Analytics, and Alerts (Figure 1).
API Analytics is responsible for covering logging and analytics for API calls, including request volume, response time, response code, and request size. The rest of this article focuses on it. Accessing API AnalyticsTo open API Analytics, first sign in to the Cloudmersive Management Portal, and then select Analytics. From the Analytics page, select the API Analytics card. The report opens with a tab bar across the top displaying your various report view options (Figure 2). Data appears only after you’ve enabled analytics for a deployed API and made API calls with an API key on your account. As mentioned earlier, if you run a Private Cloud node, you can also view analytics for that node through a tab on the node page itself, which the following section covers.
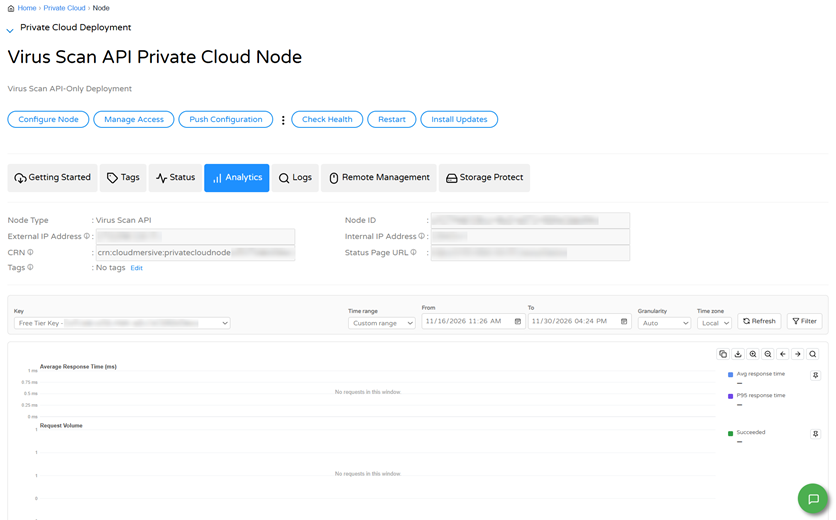
Viewing Analytics for a Private Cloud API NodeIf you’ve deployed a Cloudmersive API to a Private Cloud node, you can also view analytics for that node on its own. To view analytics for a node, first select Private Cloud in the Cloudmersive Management Portal, then select your node from the list, and finally select its Analytics tab (Figure 3).
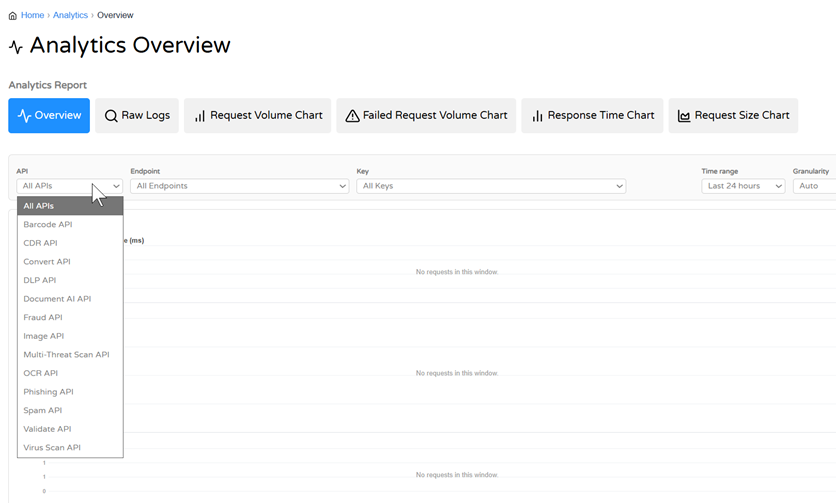
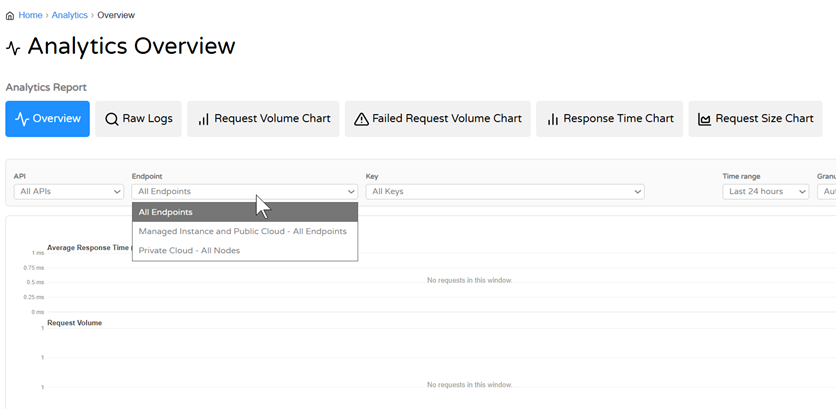
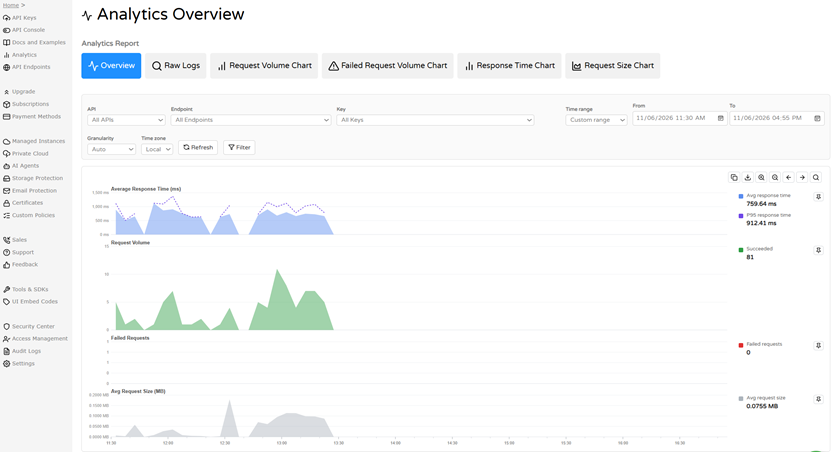
Above the report, the node’s page shows its details, including its type and addresses. The report shows data for that node only, and you won’t find API or Endpoint dropdowns as you will on other Cloudmersive Analytics pages. You can choose a Key, a Time Range, Granularity, and your preferred Time Zone. The charts underneath your node work the same as as the Overview tab of your API Analytics page, which the following section describes. Please note that Reverse Proxy nodes have their own separate analytics page, which is covered in our Reverse Proxy Analytics article. Analytics Report TabsWe’ll now walk through the API Analytics report tabs made available to you on the API Analytics page. OverviewThe Overview tab is the default API Analytics view. This gives you a quick health check of your API usage. At the top, the API dropdown lets you narrow the report to one API (such as Virus Scan API, Convert API, or Barcode API) or leave it on All APIs (Figure 4). The Endpoint dropdown chooses where the calls were made: All Endpoints, Managed Instance and Public Cloud, or Private Cloud (Figure 5). The Key dropdown narrows the report to one of your API keys.
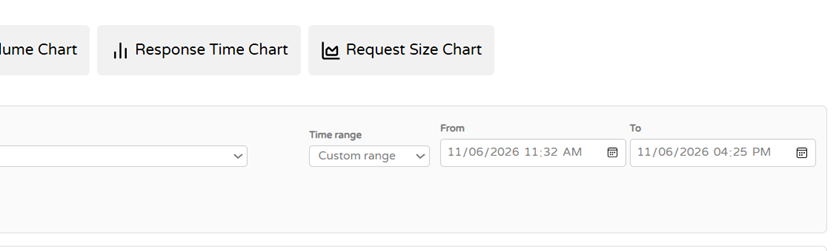
The Time range defaults to the last 24 hours, but you can choose a Custom range to set your own From and To times (Figure 6). Granularity defaults to Auto, which sets the size of each point on the charts, and Time zone defaults to Local, while UTC is also available. If the data you’re looking at becomes stale, use the Refresh button to reload it, and if you need to narrow your data down further based on certain conditions, use the Filter button.
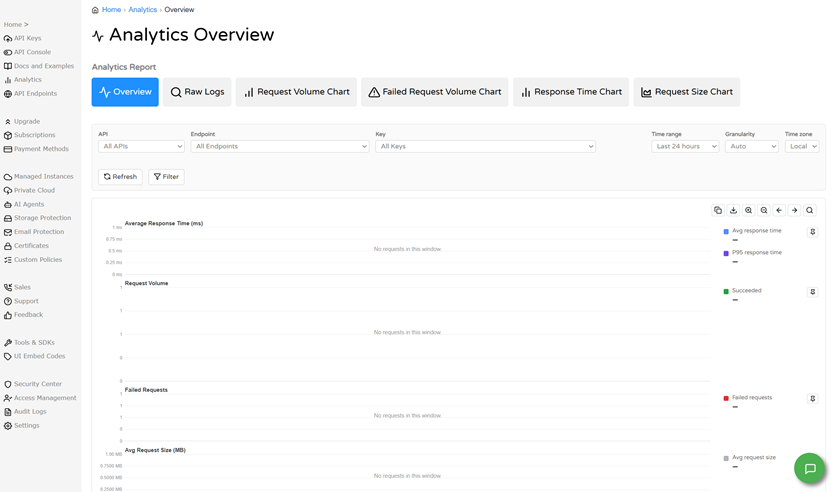
In the Overview, four charts share a single time axis (Figure 7). Average Response Time (ms) plots the average and the P95 response time, so you can see typical speed and your slowest requests. Request Volume plots requests that succeeded, which helps you spot spikes and drops in usage. Failed Requests plots requests that failed. Avg Request Size (MB) plots the average size of your requests. The legend beside each chart shows a color key and the value for your selected time window. When there were no requests in the window, the chart says “No requests in this window”, which means there was nothing to report. If you suspect a mismatch between this status and your actual API status, please fill out a support ticket.
Below the charts, the Top Requests table lists your busiest API paths with their request count, failed count, and average response time in milliseconds (Figure 8). It has its own Time range and tools to Group, Filter, and Select Columns. You can use this to find which endpoints you call the most, and which ones fail.
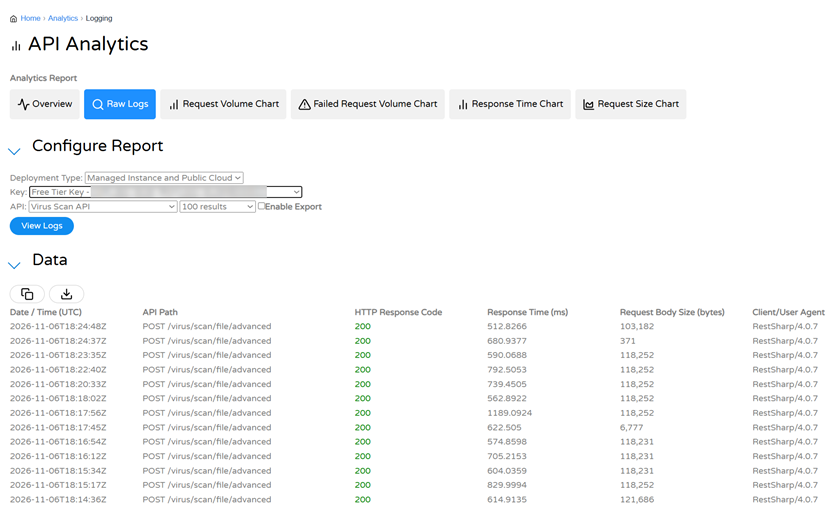
Raw LogsThe Raw Logs tab shows individual API requests, which is useful for troubleshooting purposes. Under Configure Report, you can choose a Deployment Type (such as Managed Instance and Public Cloud), a Key, an API, and how many results to return (e.g., 100), and then select View Logs to populate the page. The Data table lists each request with its own date and time in UTC, API path, HTTP response code, and other metadata shown in Figure 9. The Copy and Download buttons above the table allow you to export the results.
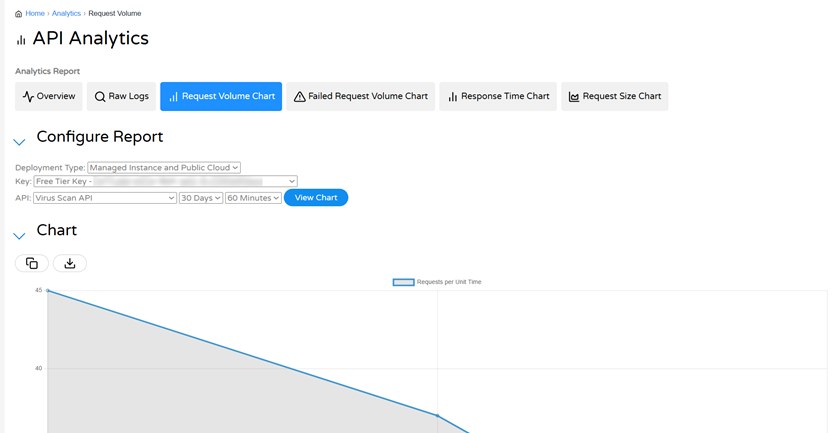
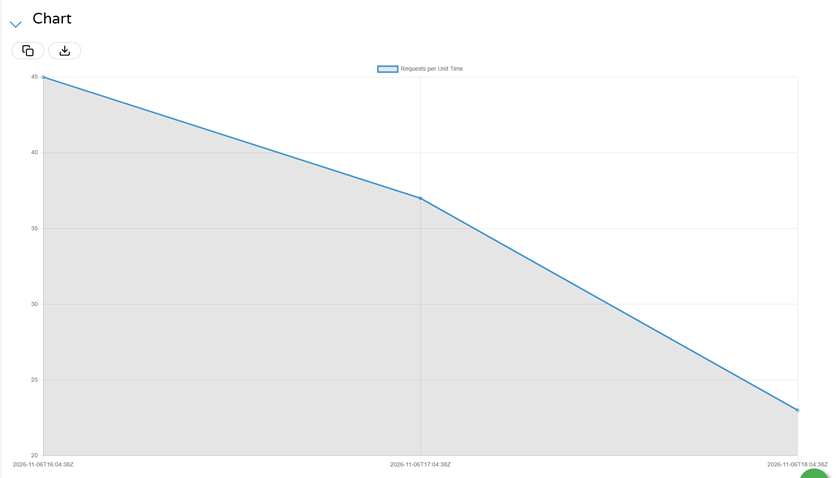
Request Volume ChartThe Request Volume Chart plots how many requests you made over time, which makes it easy to see trends and spikes in activity. Under Configure Report, you can choose a deployment type, key, API, time span (e.g., 30 days), and an interval (e.g., 60 minutes), and then select View Chart (Figure 10) to populate the page. The Requests per Unit Time chart shows one point for each interval, with timestamps in UTC along the bottom (Figure 11). The same Copy and Download buttons covered in the previous section can be found here. The other chart tabs we’ll cover use the same controls.
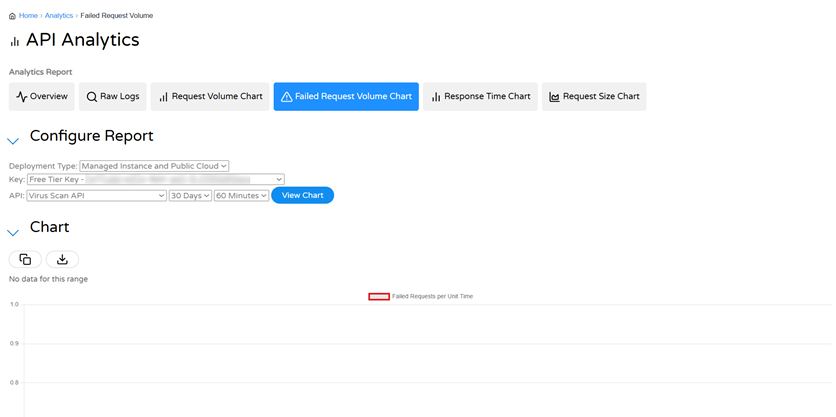
Failed Request Volume ChartThe Failed Request Volume Chart works the same way as the Request Volume Chart, only it plots failed requests, shown in red, so you can quickly see when errors occurred. If there were no failures in the range you chose, the page will say “No data for this range” (Figure 12).
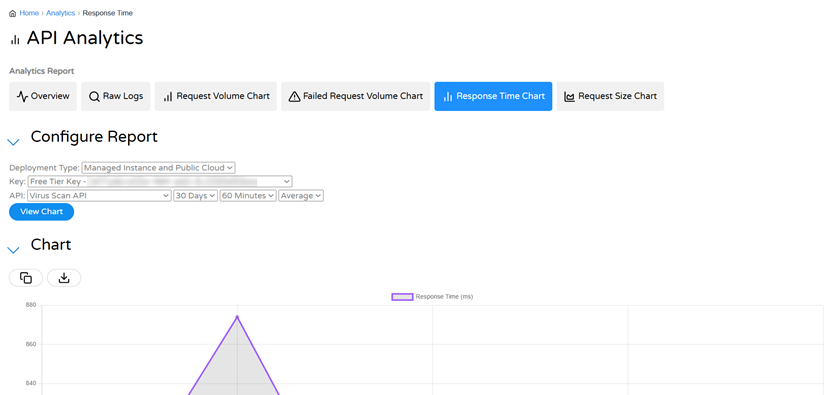
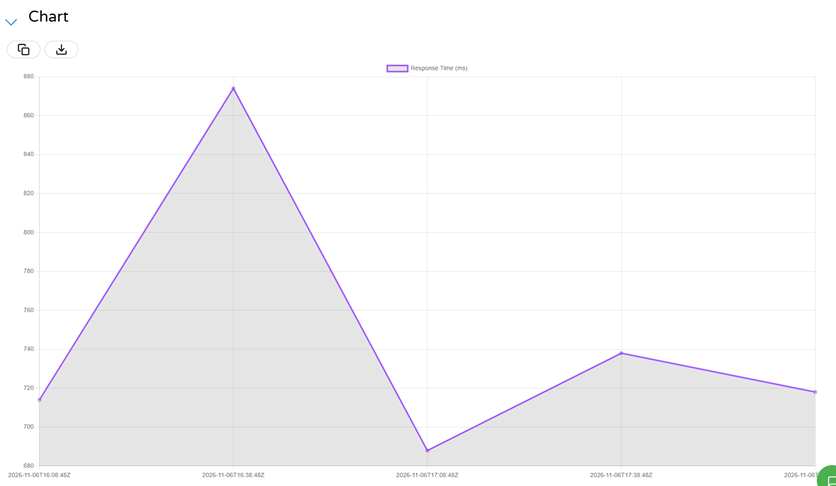
Response Time ChartThe Response Time Chart plots response time in milliseconds over your chosen time range. It adds one dropdown we haven’t covered yet, set to Average by default, which chooses how the response times for each interval are summarized (Figure 13). Your other options for this dropdown are P90, P95, and P99. This chart allows you to monitor performance and notice slowdowns in your service (Figure 14).
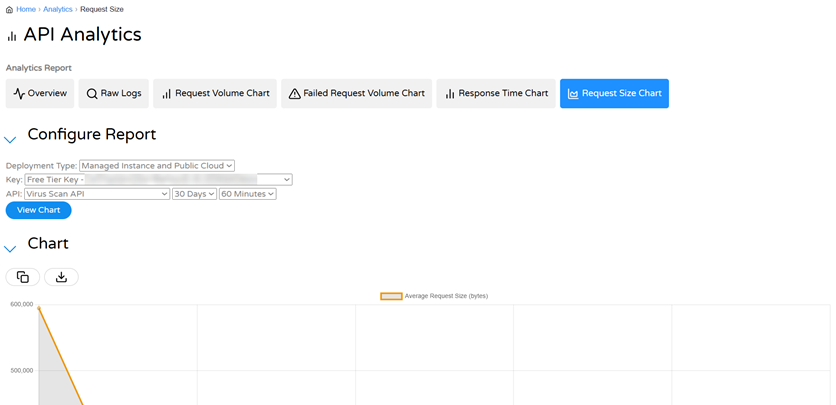
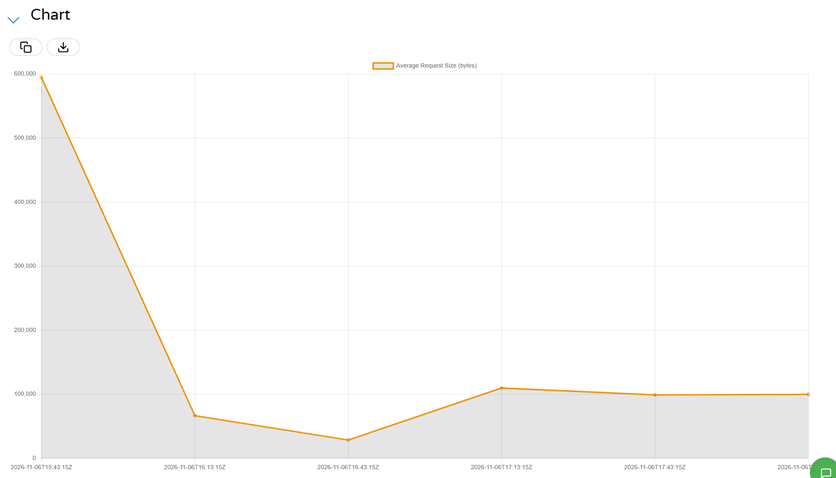
Request Size ChartThe Request Size Chart plots the average size of your requests, in bytes, over time (Figures 15 and 16). Please note that because this chart shows an average, it does not represent your total data sent. We recommend using it to spot unusually large or small requests.
Working With the DataAs we’ve mentioned in a few cases, every API Analytics report tab allows you to export the data you see using the Copy and Download buttons found beside your charts and tables. On the Overview tab, you can use the pin buttons next to your charts to add them to a Dashboard. See our article on building dashboards for more details on that subject. Related TopicsTo learn more, see our other articles on Cloudmersive Analytics, including Reverse Proxy Analytics, building dashboards, and setting up alerts. Alerts can watch your API requests and email you when usage crosses a certain threshold. |
Sign Up Now or 
 Technical Articles

 Virus Scan APIs
 Content Disarm and Reconstruction APIs
 Spam Detection APIs
 Document Conversion & Processing APIs
 Document AI APIs
 Natural Language Processing (NLP) APIs
 Optical Character Recognition (OCR) APIs
 Image and Face Recognition and Processing APIs