
|
| Cloudmersive Reverse Proxy Server Analytics |
| 11/4/2026 - Brian O'Neill |
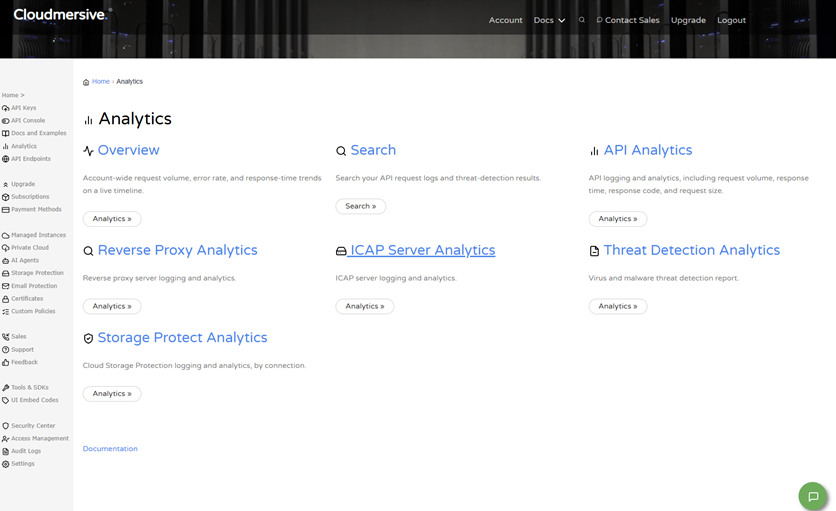
Reverse Proxy Analytics: OverviewCloudmersive Reverse Proxy Analytics offers direct visibility into the traffic handled by your Cloudmersive reverse proxy servers. Analytics tell you exactly how many requests are arriving, where those requests come from, how quickly they’re answered, and what happens to each one. Your Reverse Proxy Analytics report is organized into seven tabs: Overview, Traffic Sources, Raw Logs, Request Volume Chart, Failed Request Volume Chart, Response Time Chart, and Content Length Chart. Additional controls allow you to analyze traffic by IP address type, search for individual requests, and export charts and tables to share findings. Cloudmersive Analytics: OverviewReverse Proxy Analytics is a subset of Cloudmersive Analytics capabilities. Cloudmersive Analytics provides centralized logging and analytics across all your Cloudmersive services and deployments. From the Analytics page in the Cloudmersive Management Console, you can see an Overview of account-wide request volume, error rate, and response time trends on a live timeline, or Search your API request logs and threat-detection results. You can also access unique pages for API Analytics, Reverse Proxy Analytics, ICAP Server Analytics, Threat Detection Analytics and Storage Protect Analytics.
The Reverse Proxy Analytics page is the area dedicated to traffic handled by your Cloudmersive reverse proxy servers. It shows where requests come from, in addition to how the proxy is performing and what is happening to individual requests. In the following section, we’ll explain how to reach this page, and after that we’ll dive into some detail on what each report tab shows. Later on, we’ll explain how to analyze and search by IP address, and how to ultimately export the results. Accessing Reverse Proxy AnalyticsTo open the Reverse Proxy Analytics page, sign into the Cloudmersive Management Portal and select Analytics from the navigation menu. From there, select the Reverse Proxy Analytics option. This page displays all the Analytics Report views for your reverse proxy server nodes.
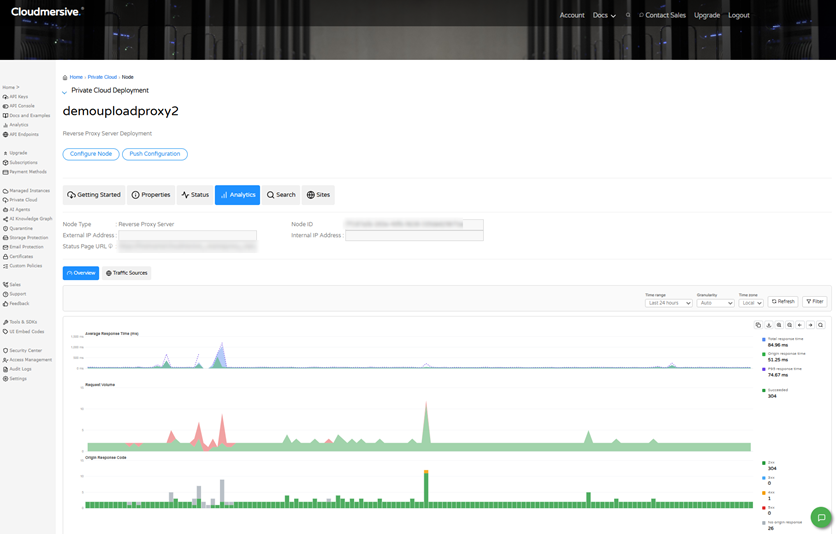
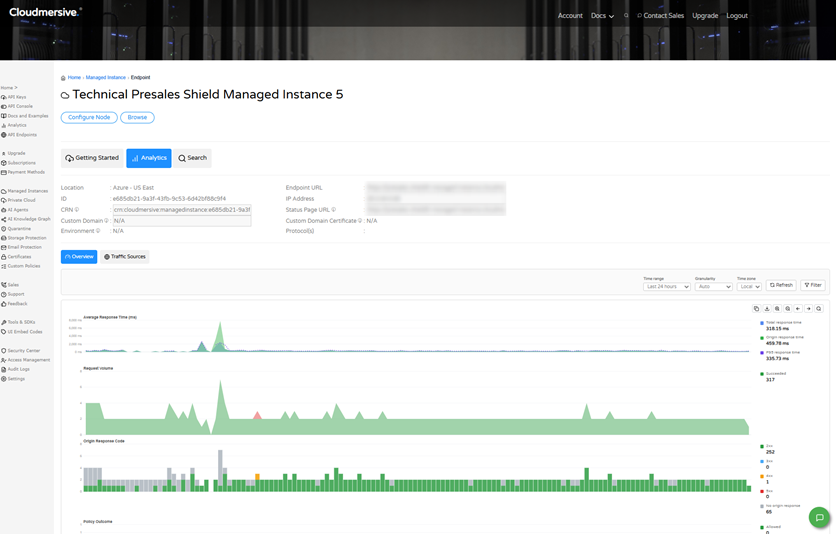
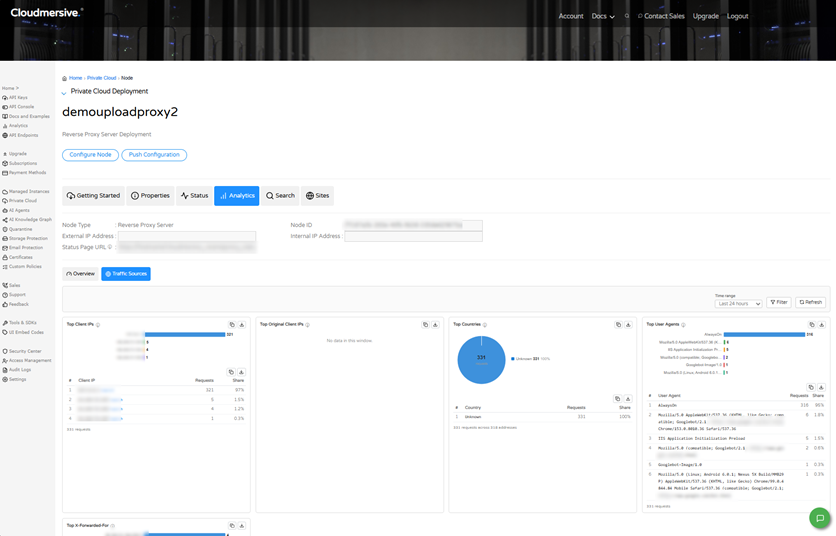
You can also view analytics for a single reverse proxy server node by opening the node and selecting its own Analytics tab. This shows the Overview and Traffic Sources tabs scoped to the selected node. The following section describes those tabs, and all other analytics tabs, in detail.
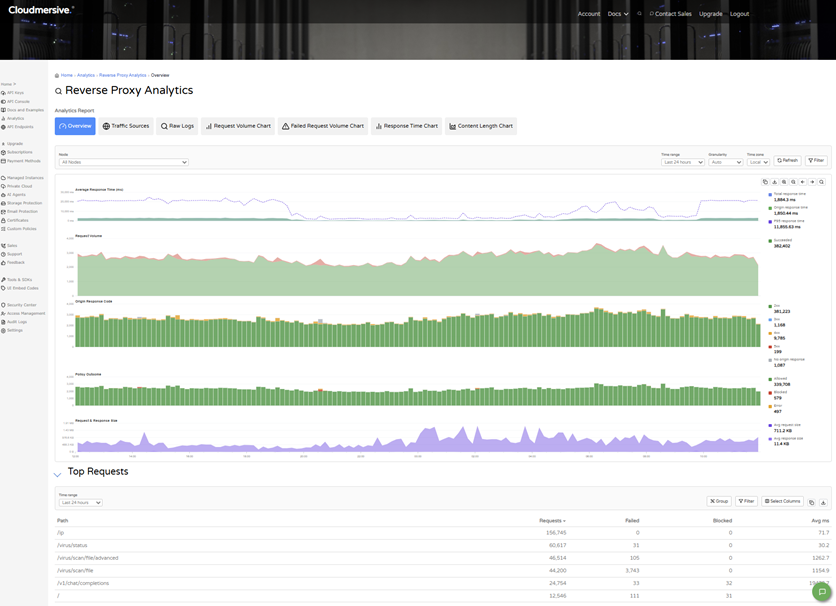
Analytics Report TabsOverviewThe Overview tab is the default analytics view. This provides a quick health check of your reverse proxy server node. At the top, the Node selector defaults to “All Nodes”, but you can use this to choose a single node and narrow your report. You can use the Time selector to view traffic over a specific period, and you can adjust Granularity to your preference. Below the controls, five charts share a single time axis.
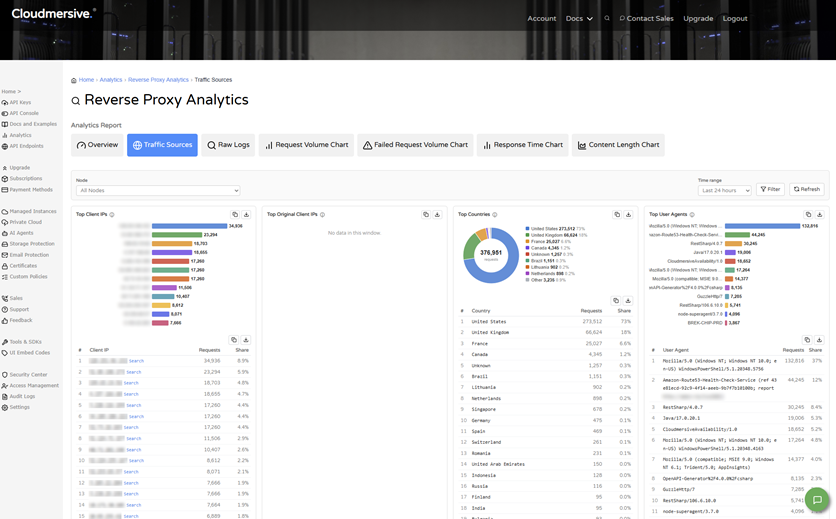
The legend beside each chart shows a color key and the value for the selected window. Below the charts, the Top Requests table lists the busiest paths. It includes the Path, Requests, Failed, Blocked, and Avg ms columns. You can use this table to find the endpoints that receive the most traffic and the ones that have the most failures or blocks. Traffic SourcesThe Traffic Sources tab shows where your reverse proxy server requests are coming from. You can use the Node and Time Range selectors to choose what to analyze, then use Filter to narrow the data, and use Refresh to reload data, which brings your page back up to date with recent traffic. Five panels summarize the traffic for the selected window, while Top Client IPs, Top Original Client IPs, and Top X-Forwarded-For rank requests by three types of IP addresses (these are described in Section 5 of this article). Top Countries shows the share of requests by country, and Top User Agents ranks the software making the requests. Each panel pairs a chart with a ranked table that shows the number of requests and the share of the total.
Raw LogsThe Raw Logs tab allows you to view individual requests handled by a specific node. This makes troubleshooting and investigation easier. You can simply choose a node, choose how many results to return for that node (e.g., 100 results), and then select View Logs. The Data table then lists each request with its date and time (in UTC), HTTP method, path, HTTP response code, response content length, origin response time (ms), total response time (ms), request body size (bytes), client and user agent, outcome, and outcome details. Request Volume ChartThe Request Volume Chart tab plots the number of requests over time for a single node. This makes it easy to spot trends and spikes in traffic. In the Configure Report section, you can choose a node, a time span (e.g., 30 days), and an interval (e.g., 60 minutes), and then select View Chart. The Chart section then displays your custom “Requests per Unit Time” chart. You can export this chart via the copy and download buttons above it. Failed Request Volume ChartThe Failed Request Volume Chart tab works almost the same as the Request Volume Chart. The difference is that it plots failed requests (shown in red) so you can quickly find when errors and outages occurred. You can choose a node, time span, and interval, and then select View Chart to display your custom Failed Requests per Unit Time chart. Response Time ChartThe Response Time Chart tab plots response time (in milliseconds) over a specific period you select. This allows you to monitor performance and notice any slowdowns that may have occurred. Like the two prior tabs, here you can also choose a node, time span, and interval, and then select View Chart to display your custom chart. Content Length ChartThe Content Length Chart tab plots the average size of responses (in bytes) over time. This is useful both for understanding the volume of data your proxy returns and for spotting any unusually large or small responses in the mix. Note that the chart shows average rather than total, so it does not represent total bandwidth. You can also customize a chart for this view by choosing a node, time span, and interval, and then selecting View Chart. Noteworthy Analytics Controls: IP Address Analysis, Search, and ExportReverse Proxy Analytics reports three unique types of IP addresses for your reverse proxy server traffic, allows you to search for a specific IP address to see its request data, and lets you export charts and tables. This section gives special attention to each of these controls. IP Address Reporting CategoriesTraffic can be broken down into the following three categories:
You can see each type of IP address in the Top Client IPs, Top Original Client IPs, and Top X-Forwarded-For panels on the Traffic Sources tab, and in the Search page filters and request records. Searching for an IP AddressTo look up a specific IP address, you can start from the Traffic Sources or from the Search page in the Analytics section of the Cloudmersive Management Portal.
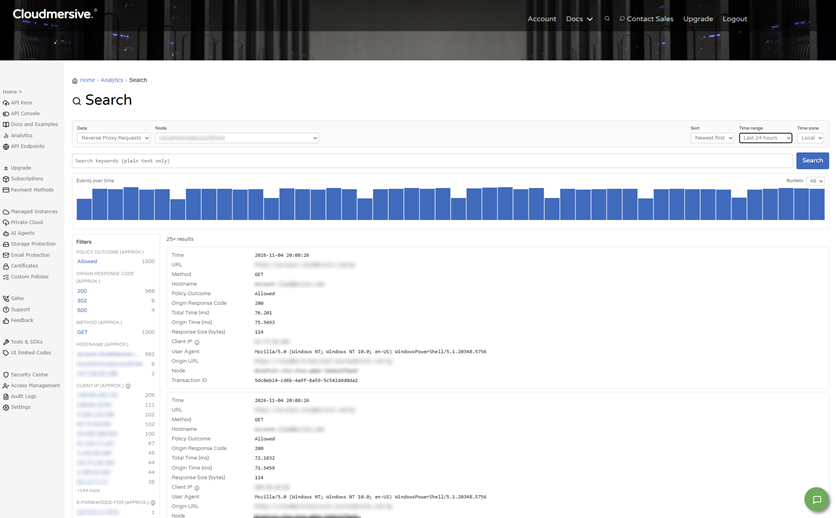
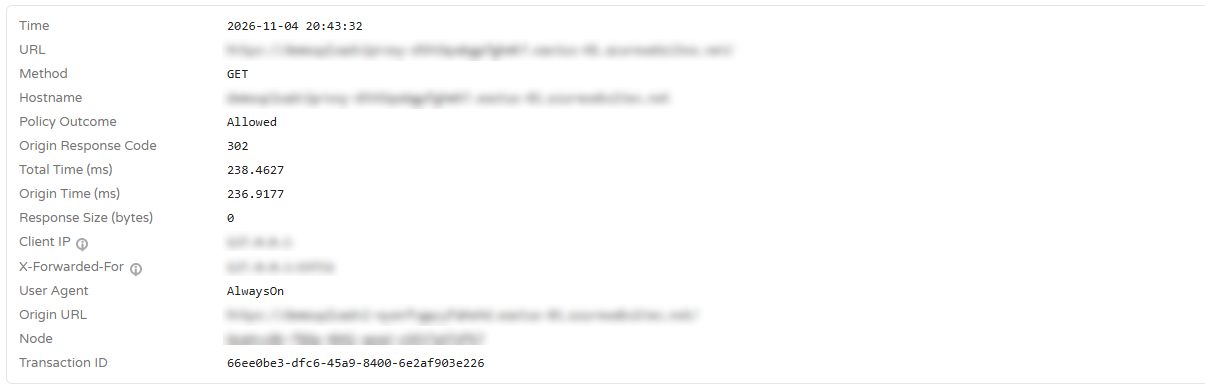
On Traffic Sources, you can select the Search link beside a client IP to open the Search page for that address. On the Search page, you can set Data to Reverse Proxy Requests, then choose a node, and then enter the address in the keyword box or select it from the Client IP or X-Forwarded-For filters on the left. The results include a histogram of events over time and a detail record for each matching request. Each record shows the time, URL, method, hostname, policy outcome, origin response code, response times, response size, Client IP, X-Forwarded-For, user agent, origin URL, node, and transaction ID. Note that Original Client IP is not shown in the screenshot below, but it will appear in the record, and can be searched, when it is available (e.g., when a CDN is in front of Cloudmersive).
Exporting Charts and TablesCharts and tables made available throughout Reverse Proxy Analytics can be exported. Next to each chart, look for the copy and download buttons on each panel. This makes it possible to share findings or include reverse proxy server data in your own reports. Working with Reverse Proxy Server Analytics DataAs we’ve noted in earlier descriptions, each Analytics Reporting tab starts with a node selector, and most also allow you to choose a time range to analyze. The Overview and Traffic Sources tabs can show all your reverse proxy nodes together in a single report or a single node, and they can always be updated with new data via the Refresh button. Note that the Raw Logs tab and the four chart tabs work with one node at a time and load their data only after you select View Logs or View Chart. Revisit Section 5 of this article for details on searching by IP address and exporting your results. Reverse Proxy Analytics Use CasesReverse Proxy Analytics supports a variety of everyday tasks. Below, we’ve included some of the most common use-cases and described how to carry them out with the analytics tabs and controls we’ve described. Check overall healthOpen the Overview tab and review response time, request volume, and response codes together. Investigate a spike in failed requestsUse the Failed Request Volume Chart to find when a failed request happened, then check the Origin Response Code chart for the specific type of error involved, and then use Search to look at the individual requests more closely. Identify unusual traffic sourcesReview Top Client IPs, Top Countries, and Top User Agents on the Traffic Sources tab, and select the Search link beside an address to see its request (if a CDN is in front of Cloudmersive, compare Client IP, Original Client IP, and X-Forwarded-For to see the real end user address). Track performance and payload size over timeUse the Response Time Chart and Content Length Chart. Learn MoreTo learn more about Reverse Proxy Server Analytics, please contact your sales representative. |
Sign Up Now or 
 Technical Articles
 Virus Scan APIs
 Content Disarm and Reconstruction APIs
 Spam Detection APIs
 Document Conversion & Processing APIs
 Document AI APIs
 Natural Language Processing (NLP) APIs
 Optical Character Recognition (OCR) APIs
 Image and Face Recognition and Processing APIs