
|
| Building Dashboards in Cloudmersive Analytics |
| 11/9/2026 - Brian O'Neill |
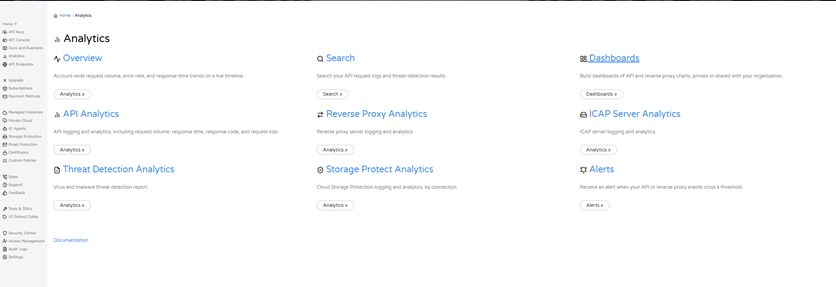
OverviewCloudmersive Analytics provides centralized logging and analytics across all your Cloudmersive services and deployments. Dashboards let you conveniently gather the charts and tables you care about most, from API Analytics, Private Cloud Analytics, and Managed Instance Analytics, onto a single page. You can keep a dashboard private, or you can elect to share that dashboard with your organization. In this article, we’ll show how to create a dashboard, add charts and tables to it, pin charts from Private Cloud Reverse Proxy analytics, and manage and share your dashboards. You can reach Dashboards from the Analytics page in the Cloudmersive Management Portal.
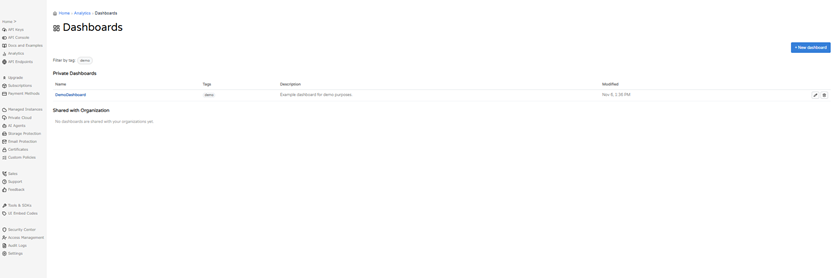
Opening DashboardsTo open Dashboards in your Cloudmersive account, first sign into the Cloudmersive Management Portal, then select Analytics, and then select the Dashboards card. The Dashboards page lists your dashboards in two groups: Private Dashboards (visible only to you) and Shared with Organization (dashboards shared with organizations you belong to). For each dashboard, the list shows its Name, Tags, Description, and when it was last Modified, along with edit and delete icons. If you have many dashboards associated with your account, you can filter the list by tag.
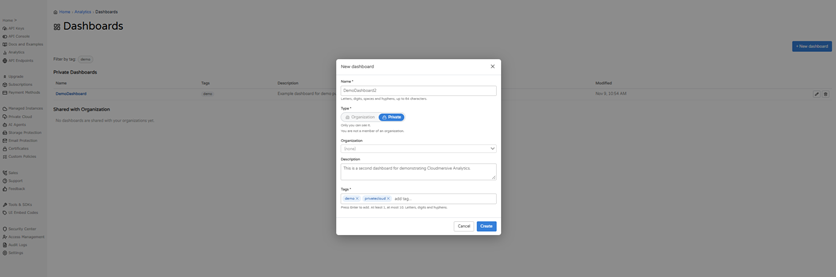
Creating a DashboardTo create a new dashboard, select + New dashboard on the Dashboards page (Figure 3). Enter a Name with up to 64 characters. Then choose Type: Private, which only you can see, or Organization, which requires membership to an organization account with Cloudmersive. Add an optional Description to your new dashboard, along with at least one Tag (up to 10), pressing Enter after each. Then select Create to finish building your dashboard.
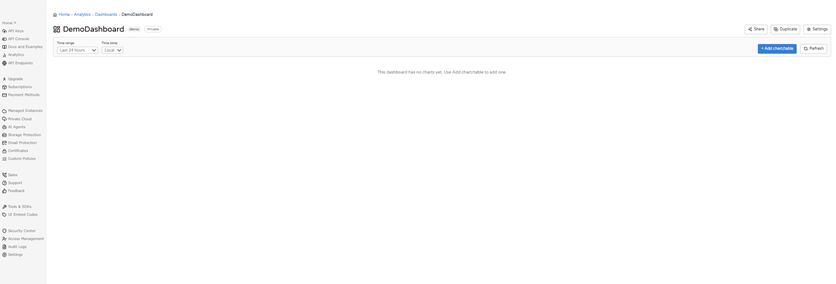
Brand-new dashboards will always open empty (Figure 4). Across the top are a Time range selector, a Time zone selector, + Add chart/table, and Refresh. In the top right are Share, Duplicate, and Settings.
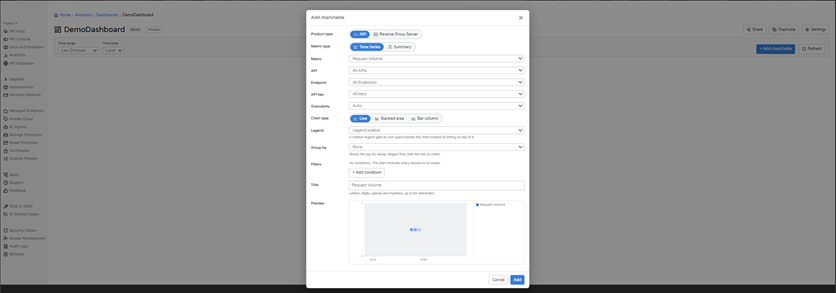
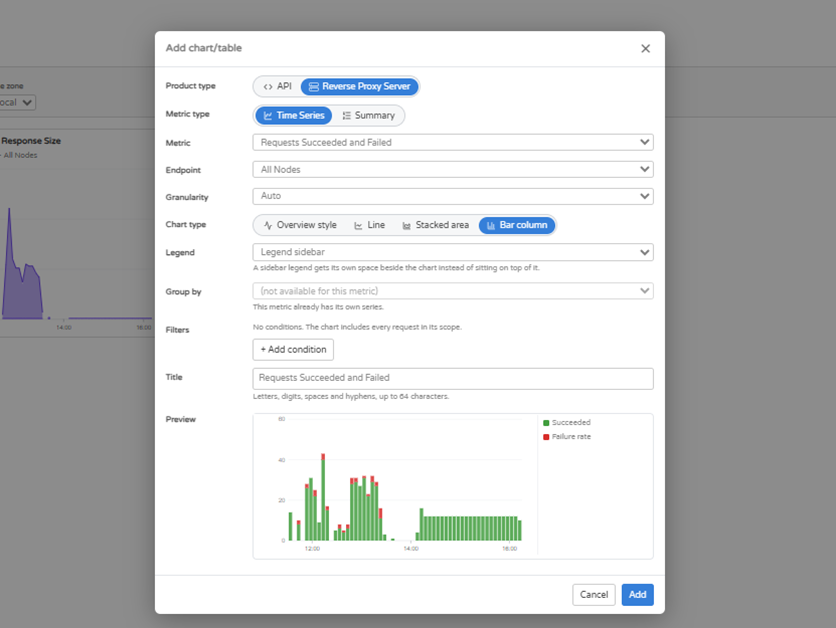
Adding a Chart or TableTo add a chart to your newly created dashboard, select + Add chart/table (Figure 5). When doing so, first choose a Product type. For example, the API option shows analytics for a specified Cloudmersive API, while Reverse Proxy Server shows analytics for your reverse proxy nodes. Then choose a Metric type: Time Series (to chart a metric over time), or Summary (to rank values over the whole time range). Each choice shows a live Preview at the bottom of the dialog. Note that all charts on your dashboard will display data from whatever time range is currently selected on the Time Range dropdown. By default, charts will show data from the last 24 hours. You can zero in on a specific time range by selecting the Custom range option from the Time Range dropdown.
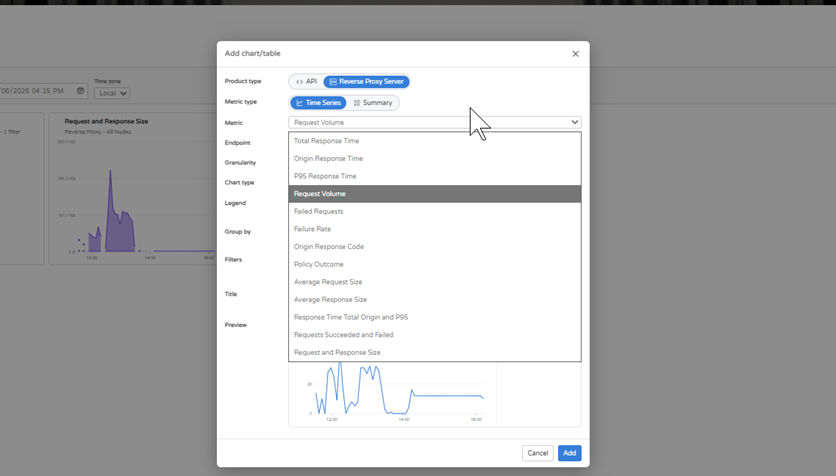
Time Series ChartsStart with the Metric. For the Reverse Proxy Server option, the choices are (Figure 6):
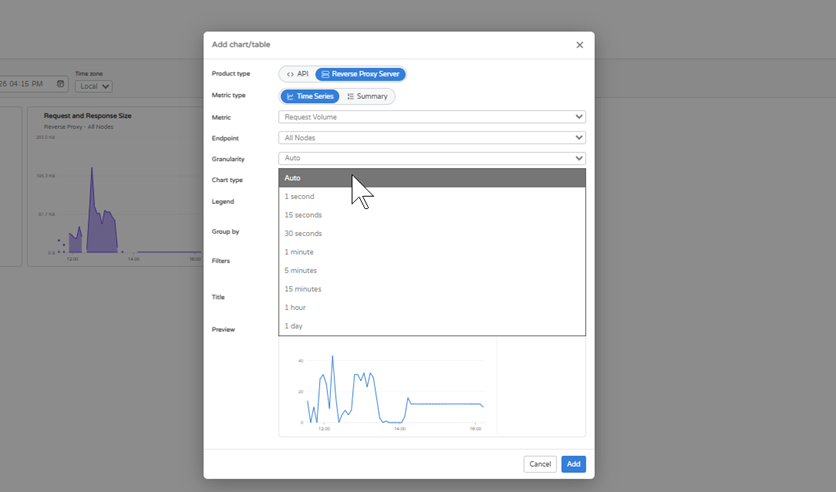
Next, choose an Endpoint: All Nodes, or a single node. For the API product, you can also narrow the chart by API, endpoint, and API key. Then (optionally) set the Granularity, which describes the time interval for each point on the chart you’re creating. Your options are (Figure 7):
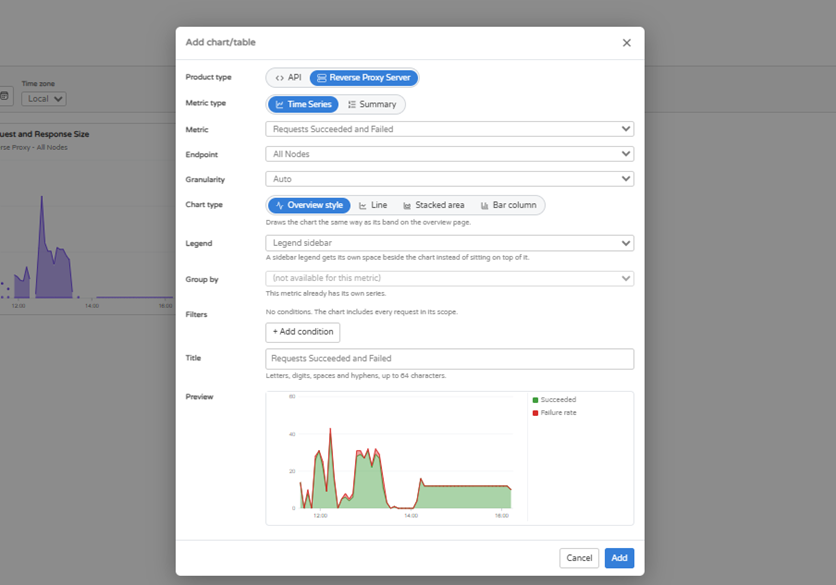
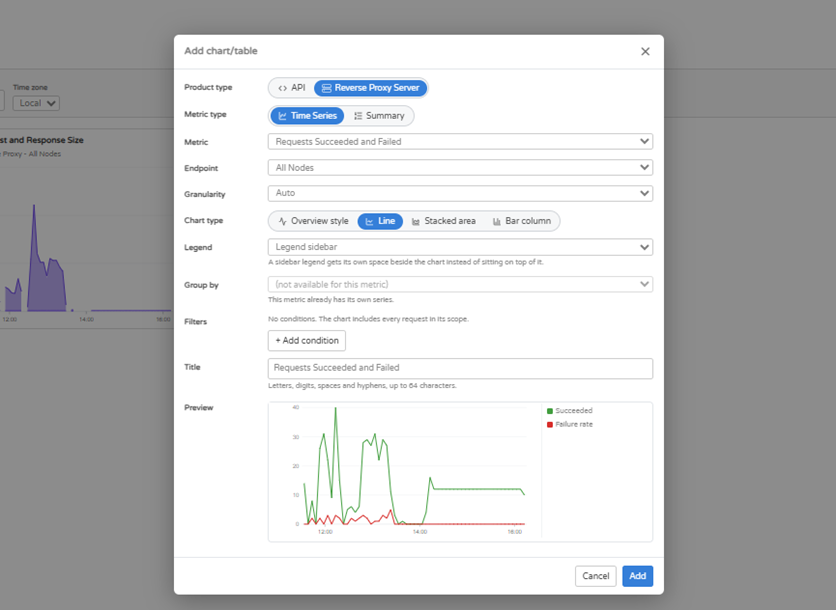
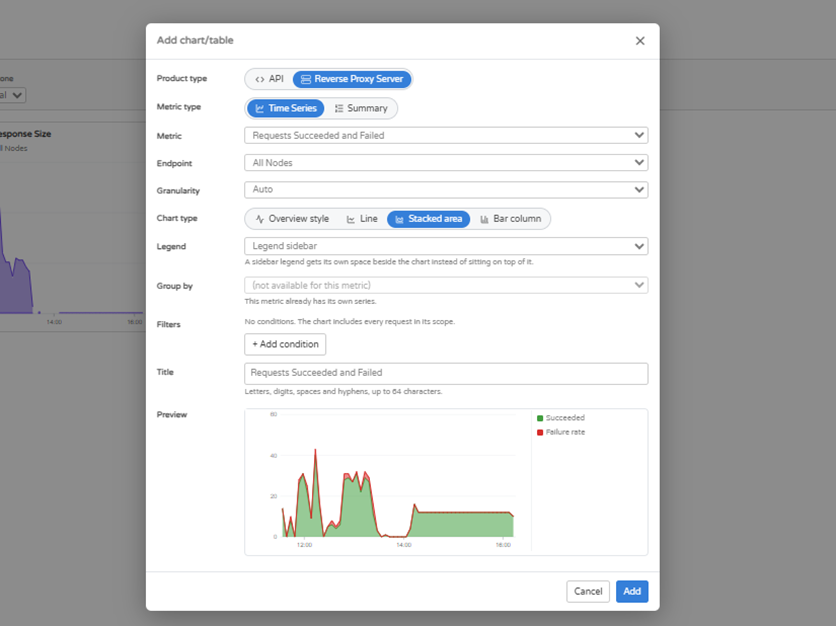
After that, pick a Chart type. Overview style draws the chart the same way as its band on the Overview page (Figure 8), and it’s available for metrics that have such a band. Line style (Figure 9), Stacked area style (Figure 10), and Bar column style (Figure 11) are your other options.
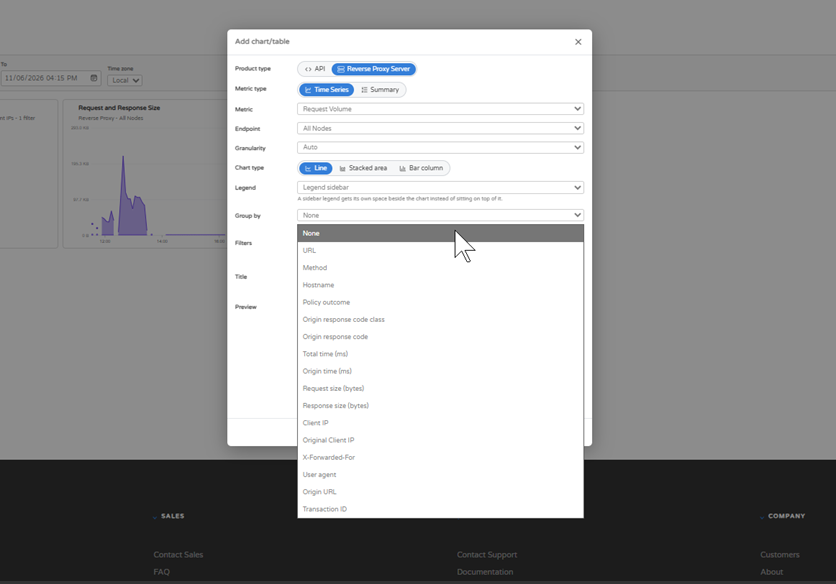
Use Group by to split a chart into separate series, such as by (Figure 12):
Group by shows the top 50 values, largest first, with the rest combined as Other. Note that some metrics (such as Requests Succeeded and Failed) already include their own series, so Group by isn’t available for them.
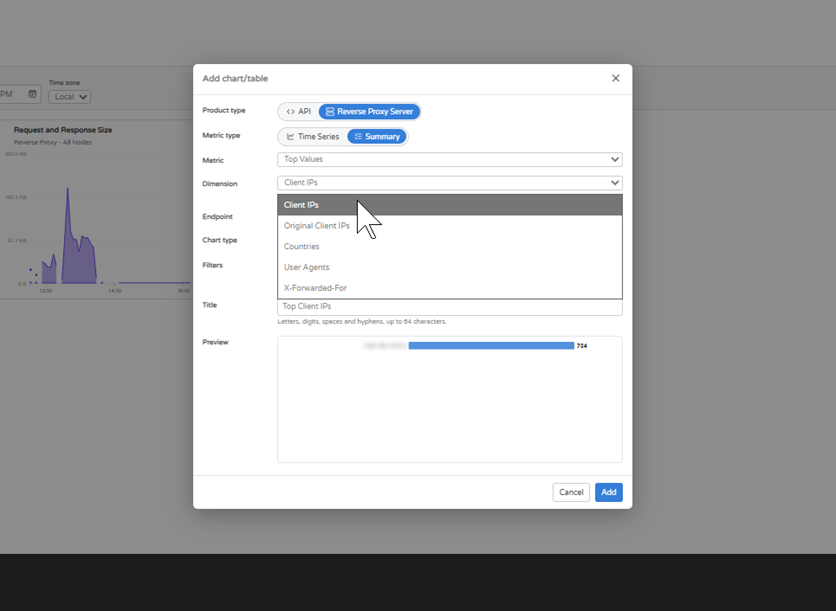
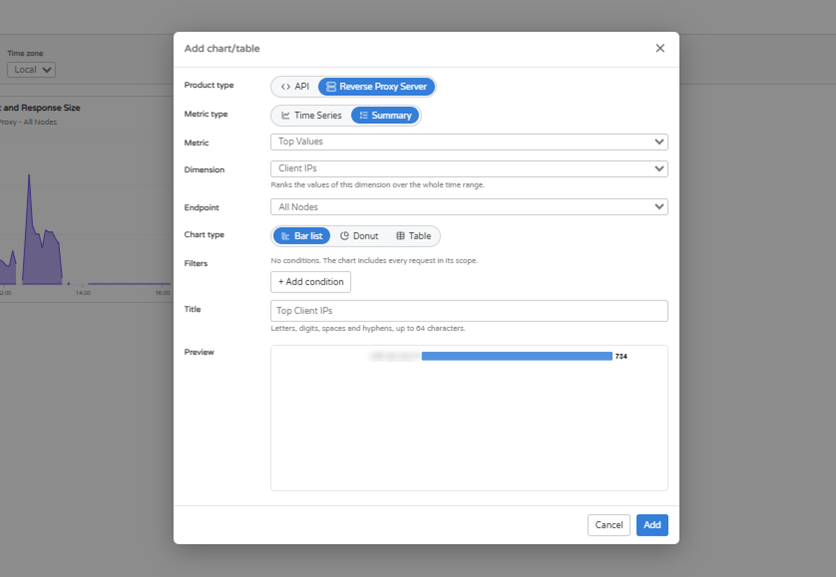
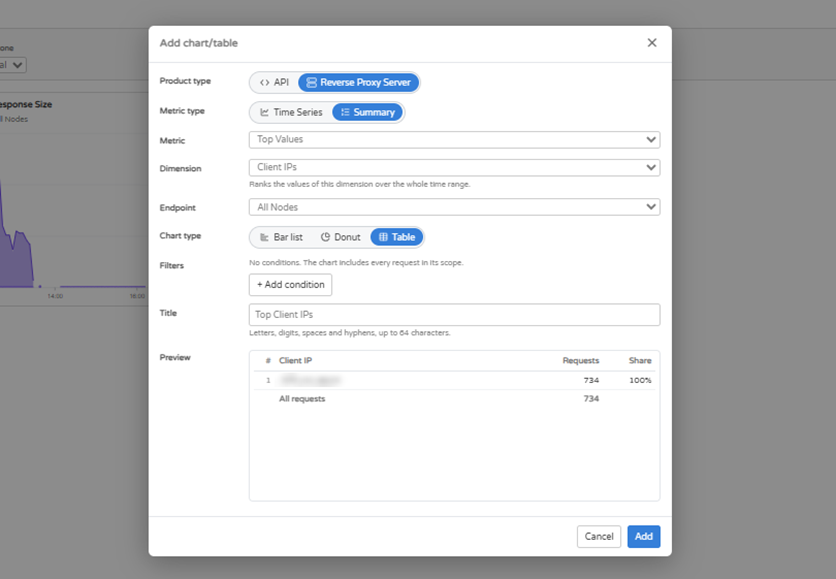
You can add Filters to limit what the chart includes. To do so, select + Add condition, and choose a field, an operator, and a value. For example, Policy outcome is Blocked. Without conditions, the chart you create includes every request in its scope. Finally, give the chart a Title and select Add to pin it to your dashboard. Summary ChartsStart by choosing a Metric. Your options for Summary charts are Top Values or Top Requests. Next, choose a Dimension, which is the value to rank. For Reverse Proxy Server, the dimensions are (Figure 13):
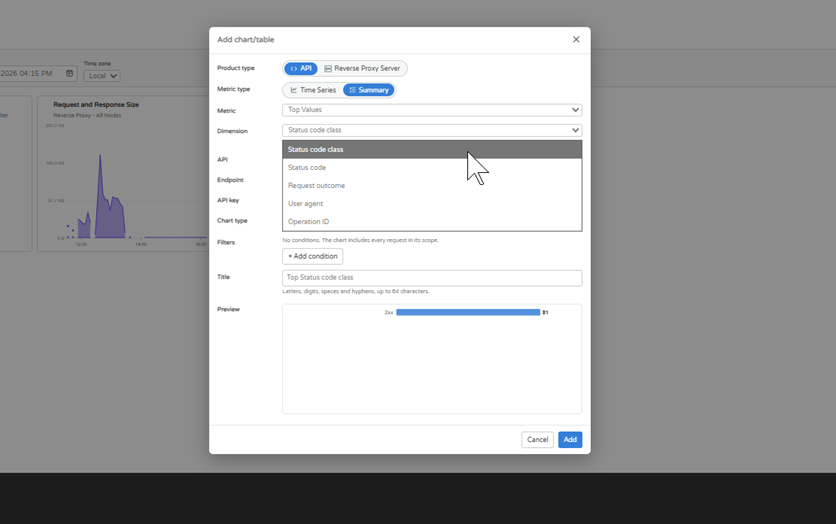
For API, they are (Figure 14):
With the API product, you can also narrow the chart by API, endpoint, and API key. The ranking covers the whole time range you selected for your dashboard.
Next, choose a Chart type. Your options are:
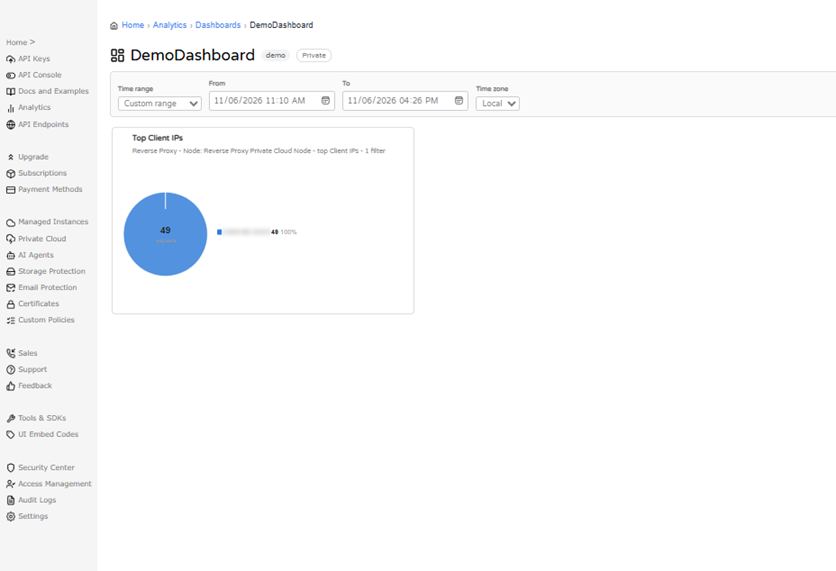
Note that Filters and Title work the same here as they do for Time Series charts. After you select Add, the chart will appear on your dashboard (Figure 18).
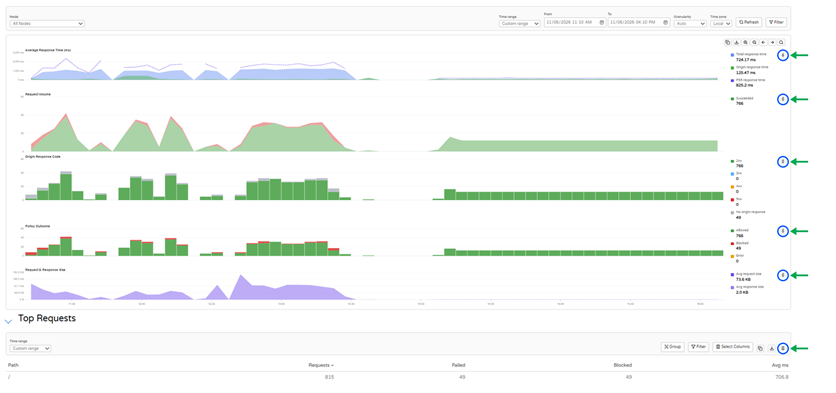
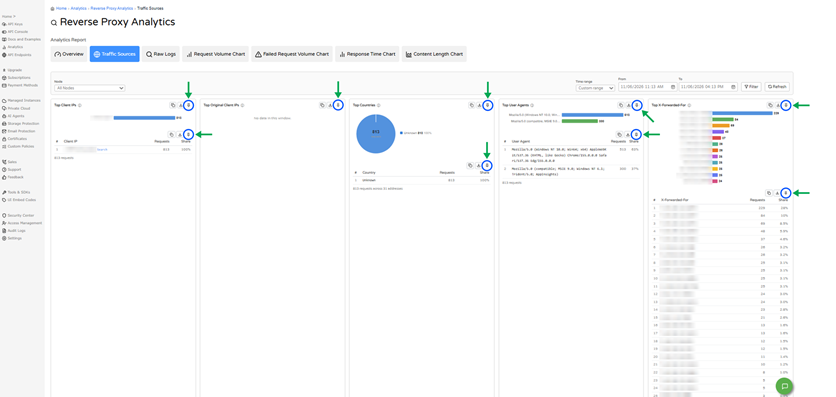
Pinning Charts from Reverse Proxy AnalyticsIn addition to creating charts within the Dashboards page, you can also build a dashboard by pinning charts from API Analytics or Reverse Proxy Analytics. On the Overview tab (Figure 19) and the Traffic Sources tab (Figure 20), look for the pin icon on each chart and table. A pinned chart keeps the same scope and filters, but it’s important to note that it follows the time range of the dashboard it’s pinned to – not the time range selected where the chart originated.
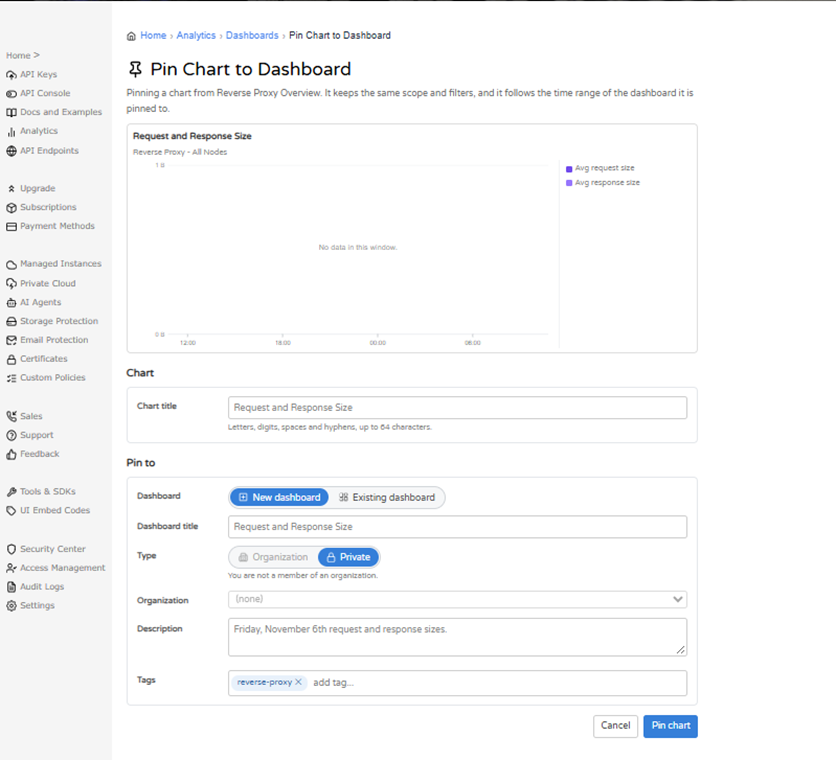
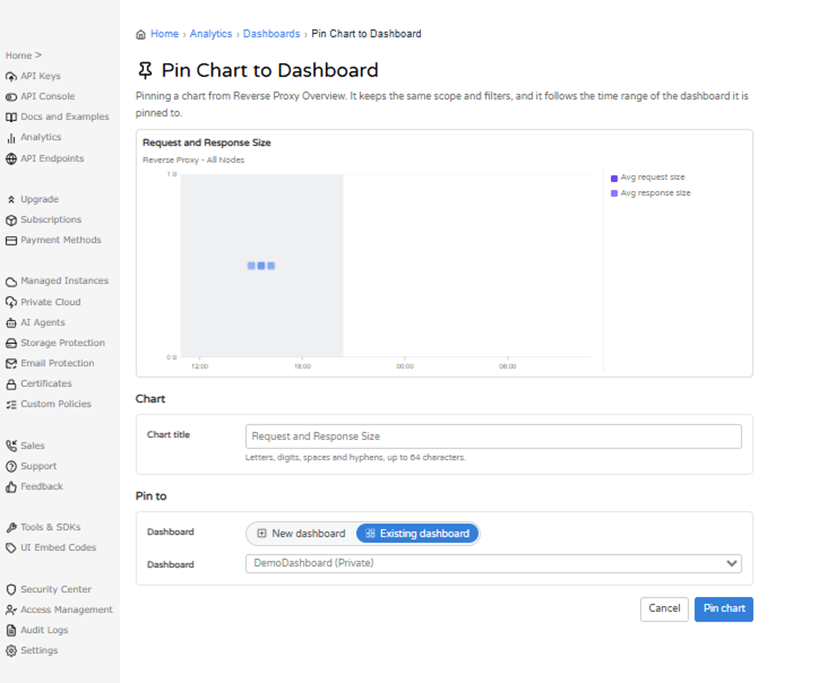
Select a pin icon to pen the Pin Chart to Dashboard page. Give the chart a Chart title, and then choose where you’d like to pin it. To pin to a new dashboard, select New dashboard and fill in a Dashboard title, Type, Description, and Tags (Figure 21). Then select Pin chart to create the dashboard with your chart on it.
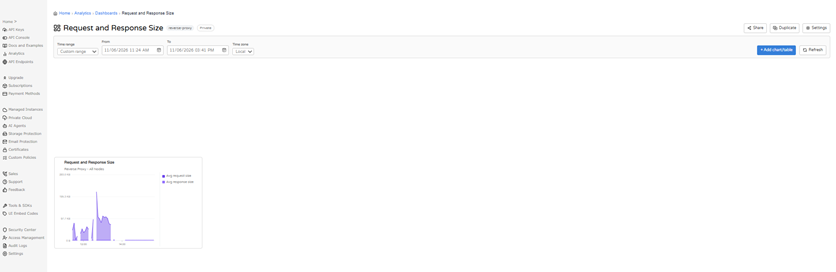
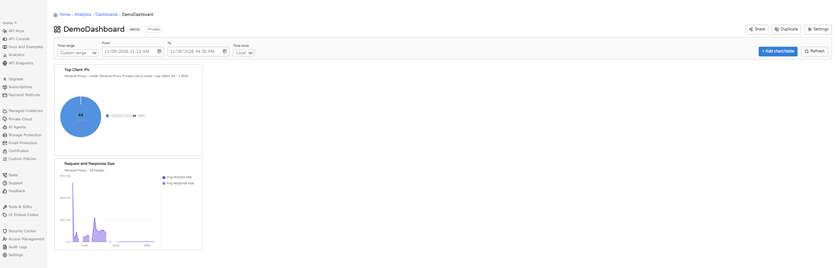
To add the chart to a dashboard you already have, select Existing dashboard, pick the dashboard from the list (Figure 23), and select Pin chart. The chart then appears on the selected dashboard alongside its existing charts (Figure 24).
Working with a DashboardTimeAs noted previously, use the Time Range and Time Zone selectors to change what any given dashboard shows. Dashboards don’t automatically update in real time, so select Refresh to load the latest available data. Moving and PositioningTo move a chart, hover over it and move your mouse to the top left corner. You will see the option to Drag to move, which is accomplished by clicking and dragging the chart from that corner. To resize a chart, hover over it and move your mouse to the bottom right corner. You will see the option to Drag to resize, which is accomplished by clicking, dragging, and expanding the chart within the Dashboards space until the desired size is reached. Chart OptionsEach chart has five buttons in its top-right corner, from left to right:
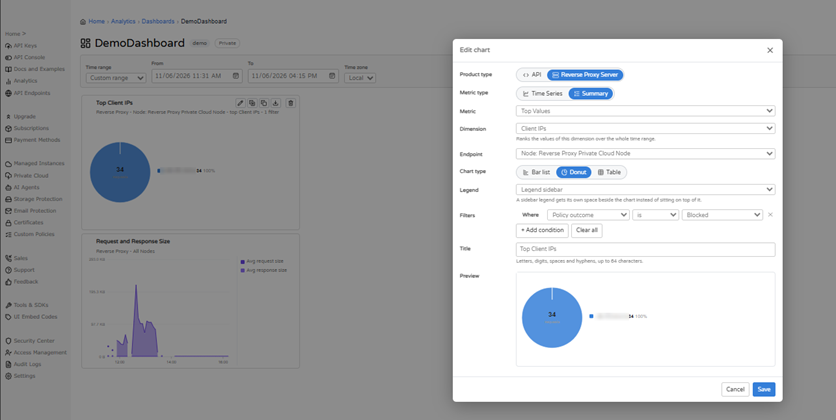
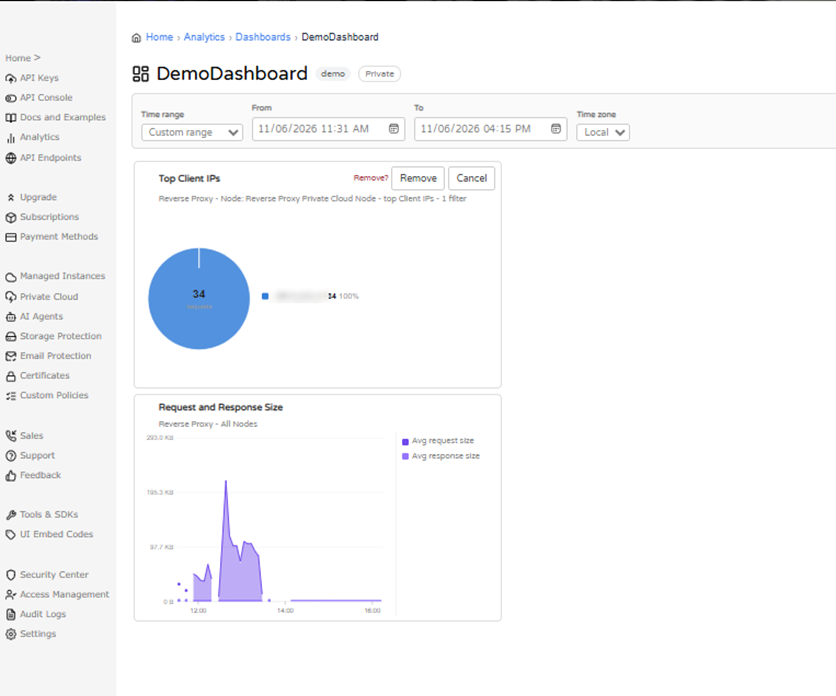
The edit button opens the Edit chart dialog, which offers the same set of options you used to create the chart (Figure 25). Duplicate makes an exact copy of the chart. Delete asks you to confirm with Remove? (Figure 26) before it removes the chart permanently from your dashboard.
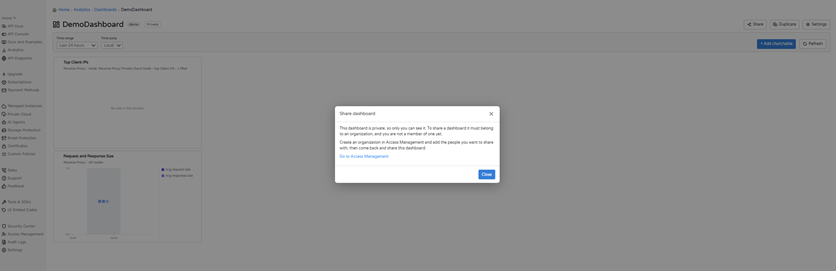
Sharing and Managing DashboardsTo share a dashboard, select the Share option in the upper right corner of the Dashboards page. Note that a dashboard must belong to an organization before it can be shared. If you aren’t a member of an organization yet, the dialog explains that you need to create an organization in Access Management and add the people you want to share with, and then come back to share the dashboard (Figure 27).
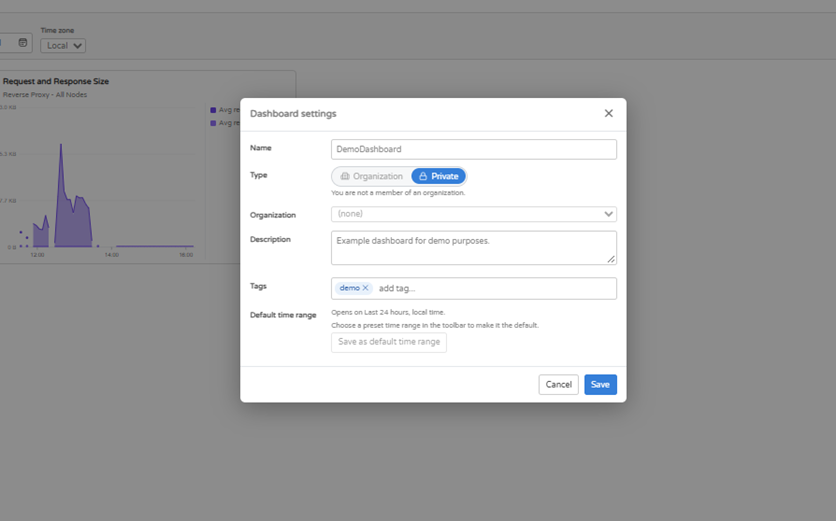
By selecting Settings (also round in the upper right corner of the Dashboards page**), you can change a dashboard’s Name, Type, Organization, Description, and Tags (Figure 28). Note that the Default time range setting controls what the dashboard opens on, which, as we’ve noted, is the last 24 hours in local time unless you decide to change it. To change it, simply pick a preset time range in the toolbar, and then select Save as default time range.
You can select Duplicate to create a copy of a dashboard. On the Dashboards list, use the edit icon to open a dashboard’s settings and the delete icon to remove it. Learn MoreTo learn more about analytics in the Cloudmersive Management Portal, see our Reverse Proxy Analytics article. To learn more about Cloudmersive Analytics, please contact your sales representative. |
Sign Up Now or 
 Technical Articles
 Virus Scan APIs
 Content Disarm and Reconstruction APIs
 Spam Detection APIs
 Document Conversion & Processing APIs
 Document AI APIs
 Natural Language Processing (NLP) APIs
 Optical Character Recognition (OCR) APIs
 Image and Face Recognition and Processing APIs