
|
| Understand Every API Request with Cloudmersive API Analytics |
| 8/3/2026 - Brian O'Neill |
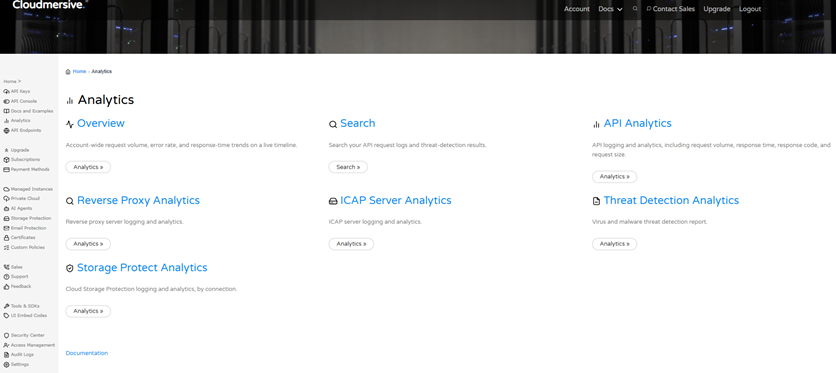
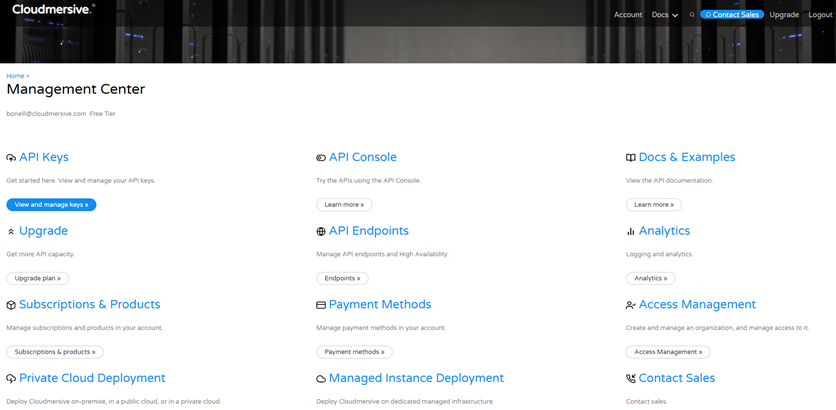
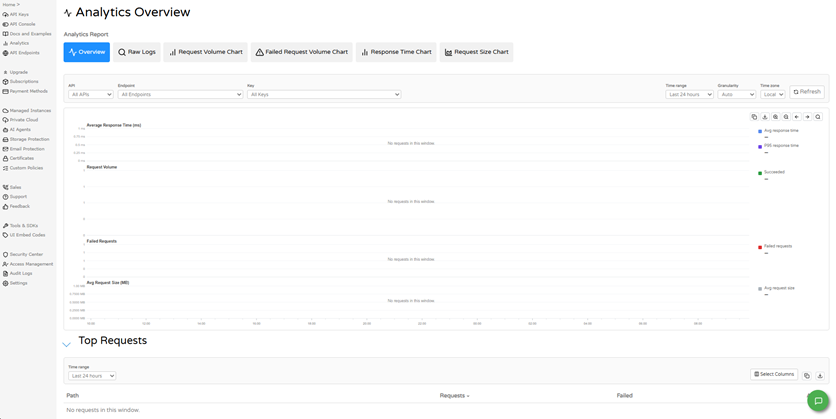
Cloudmersive API requests arrive from applications, automated workflows, cloud platforms, and low-code tools throughout the day, but the activity behind those requests isn’t always easy to see from the application side alone. Cloudmersive Analytics brings that activity into view. From broad usage trends to individual request records, customers can use the Cloudmersive Management Portal (CMP) to understand how their Cloudmersive services are being used, investigate unexpected behavior, and make better-informed operational decisions. That visibility becomes especially valuable as more teams and applications begin sharing the same API platform. A sudden increase in request volume might reflect a successful rollout, an unusually busy workflow, or an integration calling an endpoint more often than intended. A response-time spike might line up with larger files, or an increase in failed requests might point to one API, one key, or one recurring request pattern. Cloudmersive Analytics gives customers a practical place to begin answering those questions. In this post, we’ll take a brief look at the broader Analytics experience before taking a page-by-page tour of the API Analytics center. Big picture: Cloudmersive Analytics turns activity into operational contextCloudmersive Analytics is designed to support several different kinds of visibility across the Cloudmersive platform. Customers can review broad account activity, search request logs and threat-detection results, analyze individual API usage, and access specialized analytics experiences for products such as Reverse Proxy, ICAP Server, Threat Detection, and Storage Protection. Each view answers a different operational question. A security team might need to investigate threat findings from scanned files, while an application owner may be more interested in request volume, response times, or failed API calls. Bringing these experiences together inside the CMP makes it easier to move from a high-level observation to the specific activity behind it. Analytics is observational: it shows teams what happened and provides the evidence needed for investigation. It complements the API configurations, security policies, and workflow logic that determine what applications should do next. Finding Analytics in the Cloudmersive Management CenterWe’ll begin on the Cloudmersive Management Center page. This is the main navigation point for Cloudmersive account and platform capabilities, including API Keys, API Console, API Endpoints, deployment options, payment and subscription management, Access Management, and Analytics. The Choosing the right Analytics experienceThe Analytics landing page organizes available reporting tools into clear categories. From the same page, customers can open This separation keeps each analytics experience focused without fragmenting access. Customers can begin with the type of activity they care about and then move into a purpose-built view with the relevant filters, charts, and logs. For the rest of this tour, we’ll zoom in on the Begin with the API Analytics OverviewThe Filters across the top of the page let customers narrow the report by The main report area presents four complementary measurements:
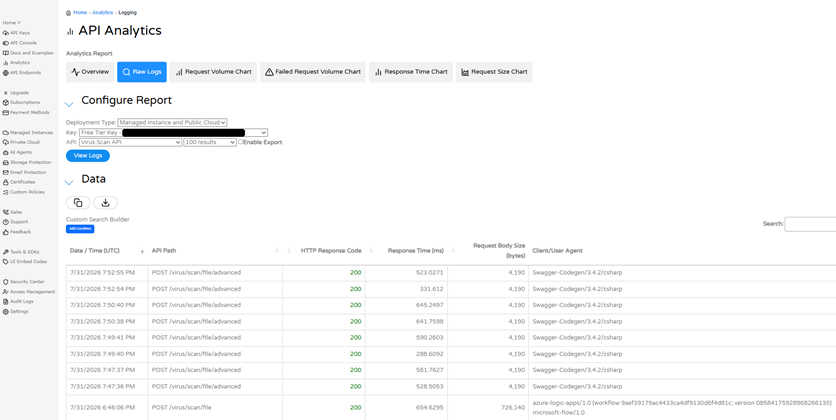
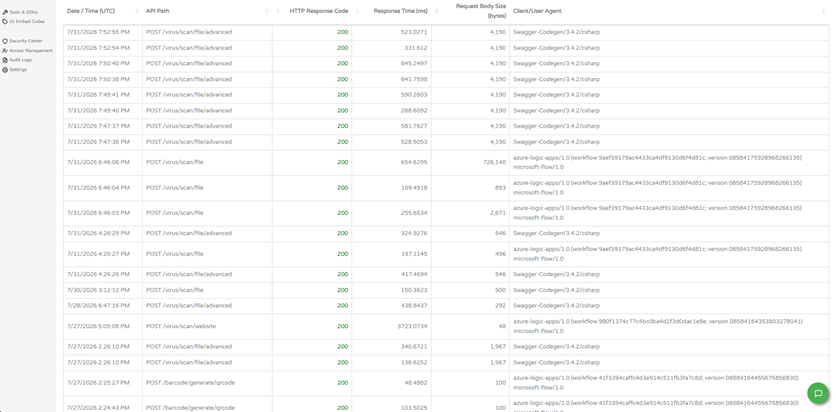
Viewed together, these charts provide useful context that would be easy to miss when looking at a single measurement. A rise in response time, for example, may be more meaningful when it occurs alongside a sharp increase in request volume or average request size. The Investigate individual requests with Raw LogsCharts are excellent for recognizing patterns, but troubleshooting often comes down to individual events. The The The table breaks each request into practical operational fields:
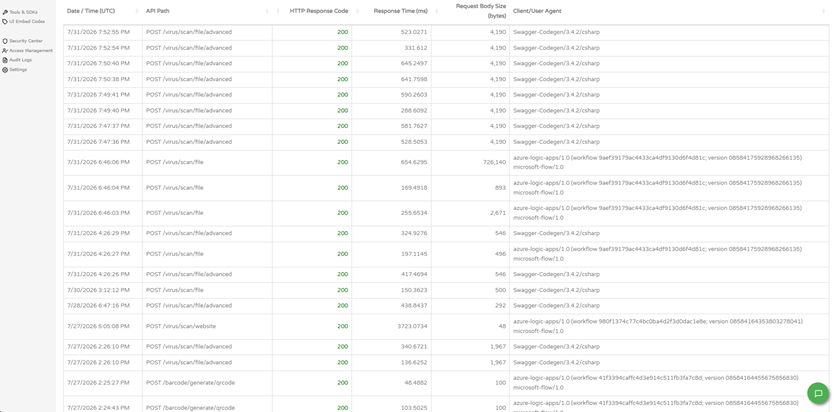
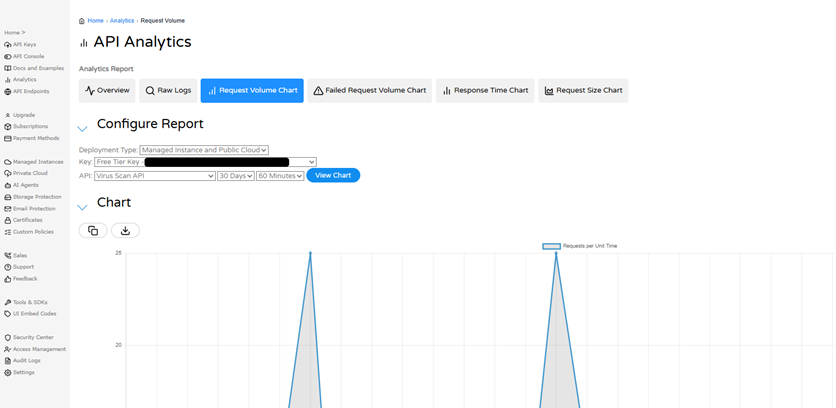
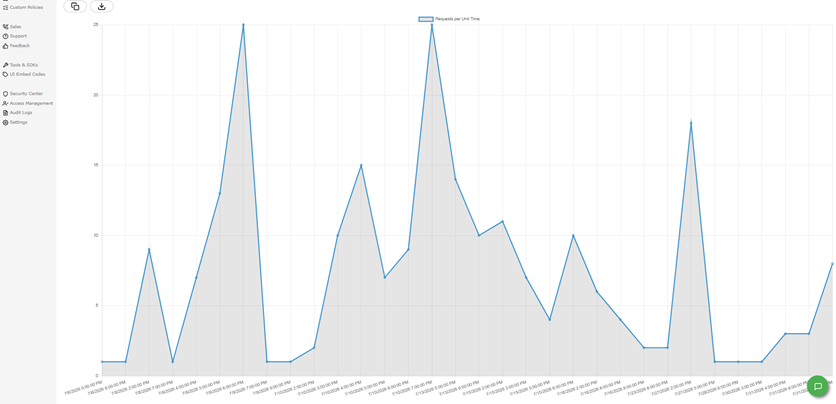
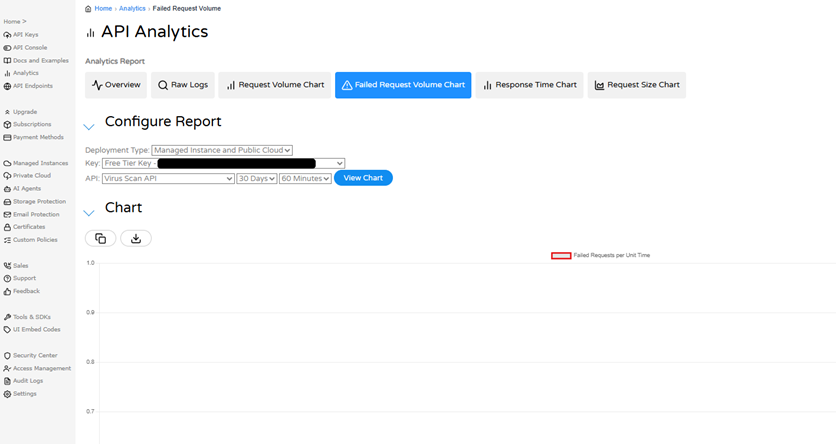
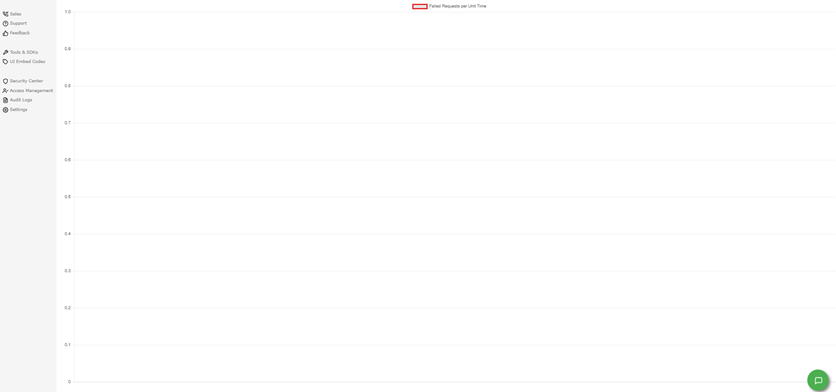
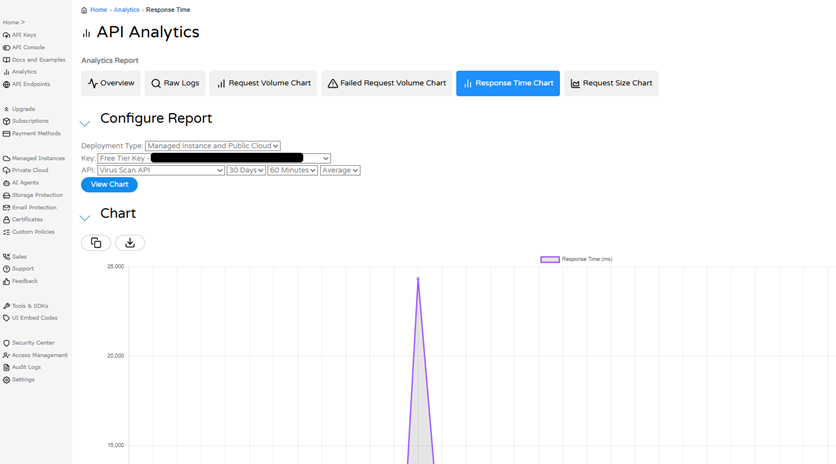
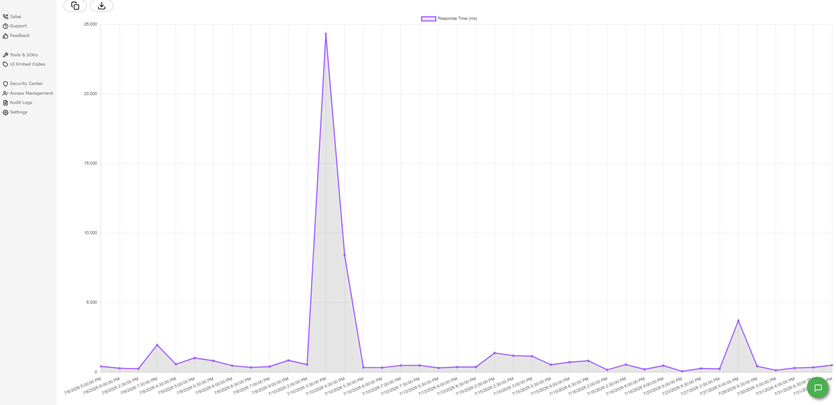
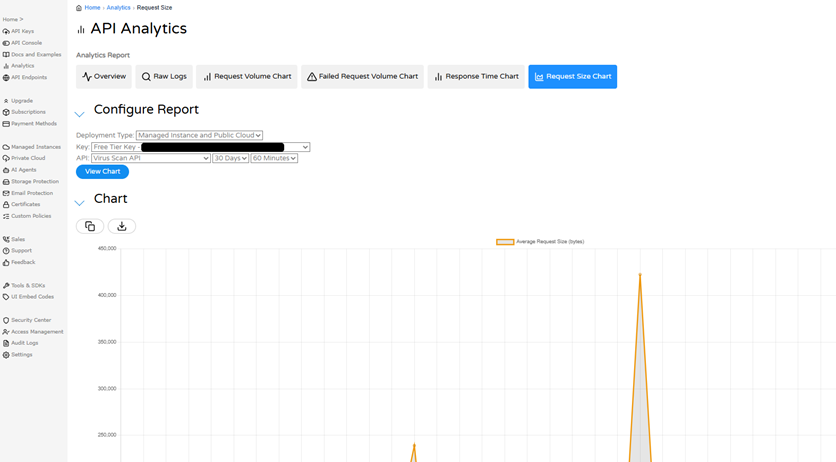
In the example shown, the records include Advanced Virus Scan API calls made through a C# client and Virus Scan API calls originating from Microsoft workflow services. This makes the page useful for more than confirming whether a request succeeded; customers can connect request behavior to the systems generating it and compare response time or payload size across different clients. The page also includes a standard table search and a Understand usage patterns with Request VolumeThe The report can be configured by The chart plots Volume alone doesn’t indicate whether activity is healthy or problematic, but it provides essential context for every other measurement. A response-time increase during a request spike means something different from the same increase during otherwise quiet activity. The chart’s copy and download controls also make it straightforward to move the visualization into a report or share it with another team. Identify reliability trends with Failed Request VolumeThe This page uses the same familiar report controls for The chart measures When failures do appear, their timing provides a starting point for investigation. Customers can compare the spike with total request volume, then move into Monitor performance with the Response Time ChartThe Along with the standard The focused chart makes typical activity and outliers easy to distinguish. Most response times in the example remain comparatively low, while one request period rises sharply above the surrounding measurements. That spike is a signal to investigate, not a conclusion by itself. Customers can compare the timing of an outlier with the Add workload context with the Request Size ChartThe Customers can filter the chart by In the focused example, several pronounced peaks stand out from the normal request-size pattern. Those peaks may correspond to larger file submissions or periods when a different workload was active. Comparing their timestamps with response-time and volume data helps customers determine whether payload size contributed to a performance change or simply reflects expected variation in the files being processed. For request-level confirmation, Move naturally from monitoring to investigationThe real value of API Analytics becomes clear when its pages are used together. The Overview page provides a broad operational picture. The dedicated charts isolate volume, failures, response time, and request size. Raw Logs then supplies the individual records needed to explain what happened. A customer might notice a response-time spike, confirm that it aligns with a large request, identify the relevant endpoint and calling client in Raw Logs, and determine whether the event was isolated or repeated. The same workflow can begin with a failure trend, an unexpected traffic increase, or a change in average payload size. Simply put, Cloudmersive API Analytics gives customers a clearer line of sight from platform-wide activity to the requests behind it. That visibility makes routine monitoring easier and gives developers, IT teams, and operations teams a shared source of evidence when something needs attention. Explore API AnalyticsCloudmersive customers can access Analytics through the Cloudmersive Management Portal and select To learn more about making API Analytics part of your monitoring and troubleshooting process, contact a Cloudmersive representative for guidance tailored to your environment. |
Sign Up Now or 

 Blog
Blog
 Virus Scan APIs
 Content Disarm and Reconstruction APIs
 Spam Detection APIs
 Document Conversion & Processing APIs
 Document AI APIs
 Natural Language Processing (NLP) APIs
 Optical Character Recognition (OCR) APIs
 Image and Face Recognition and Processing APIs