
|
| Explore Threat Detection Analytics in the Cloudmersive Management Portal |
| 8/18/2026 - Brian O'Neill |
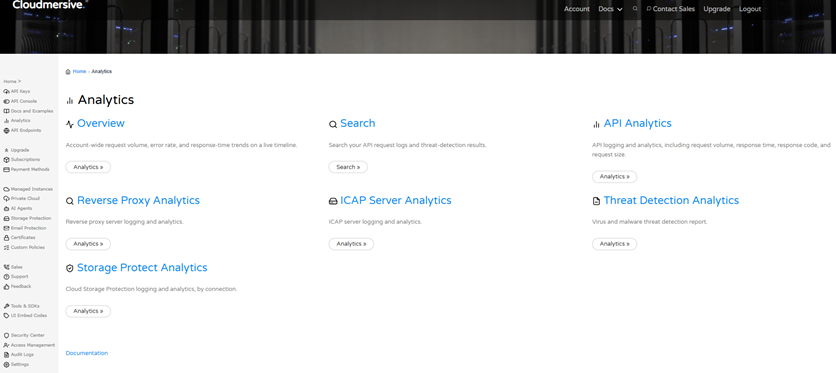
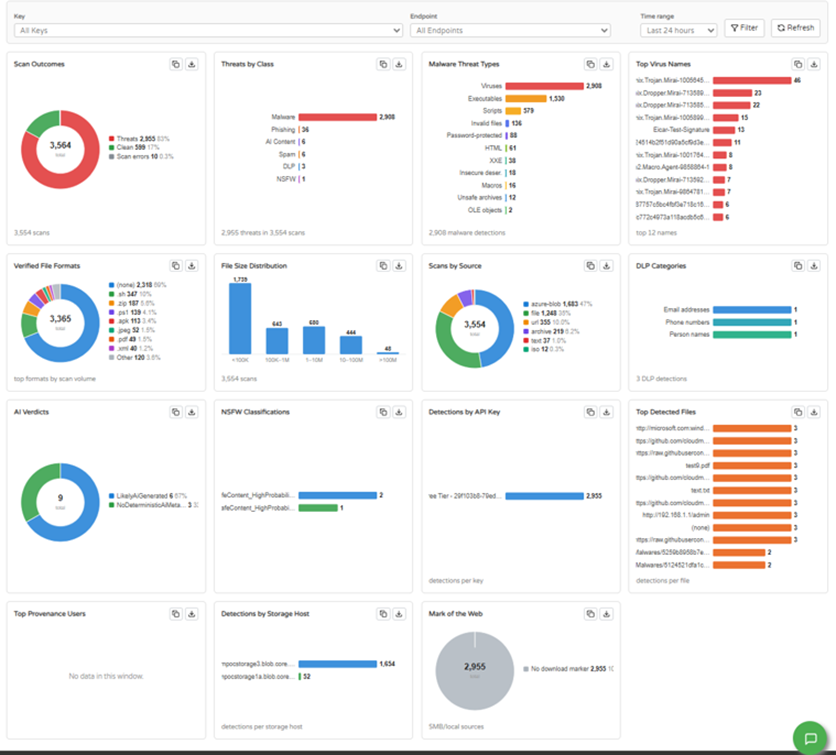
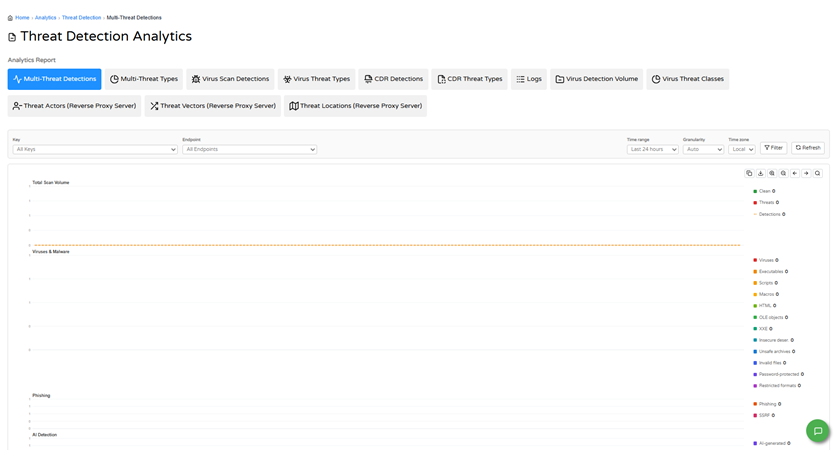
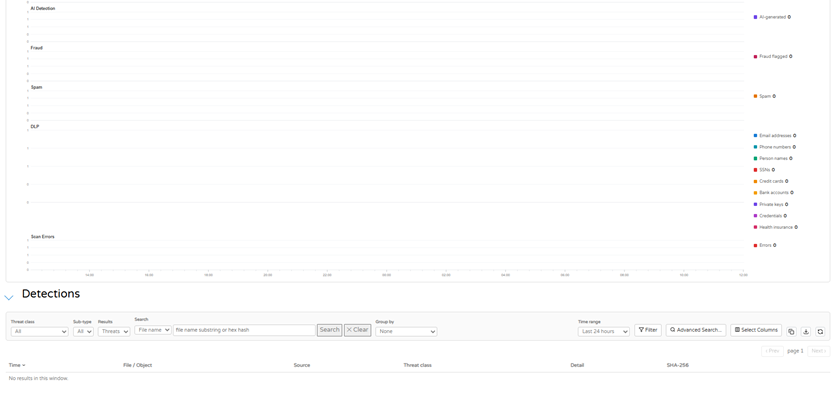
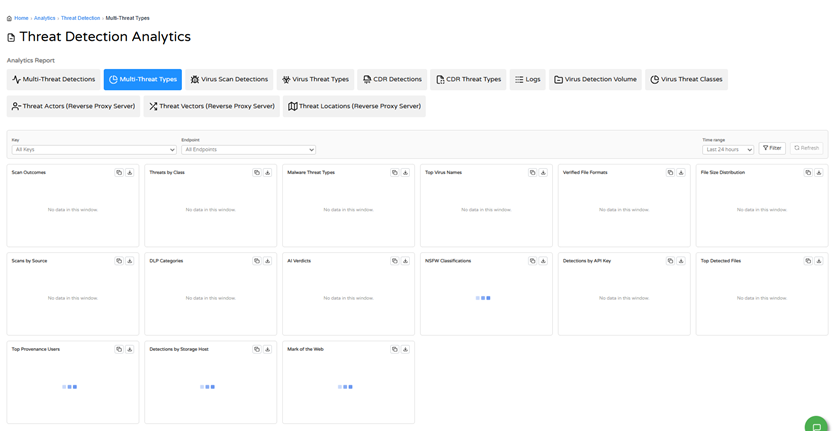
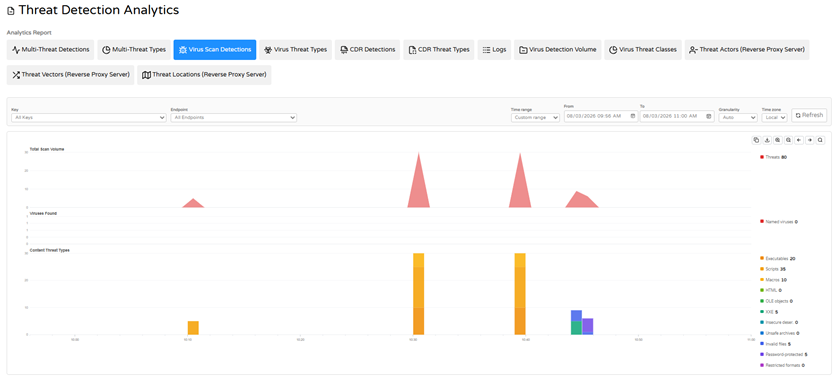
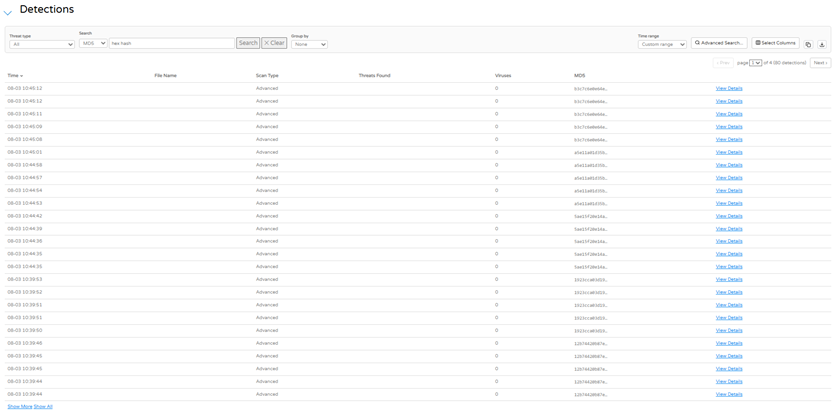
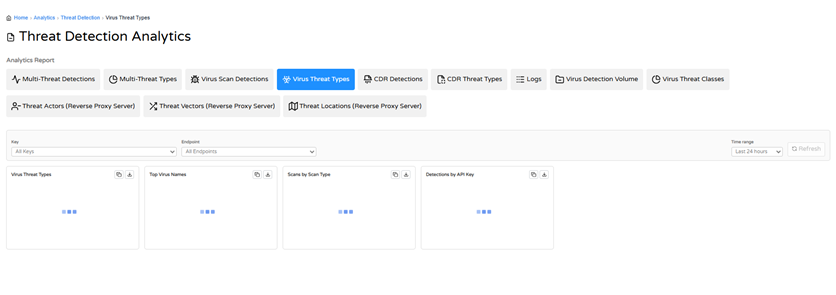
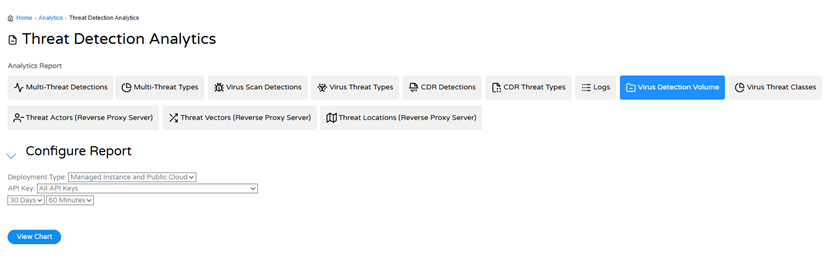
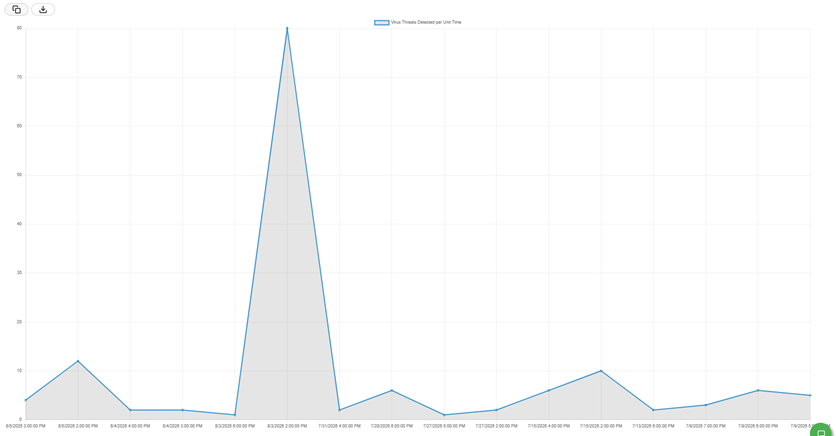
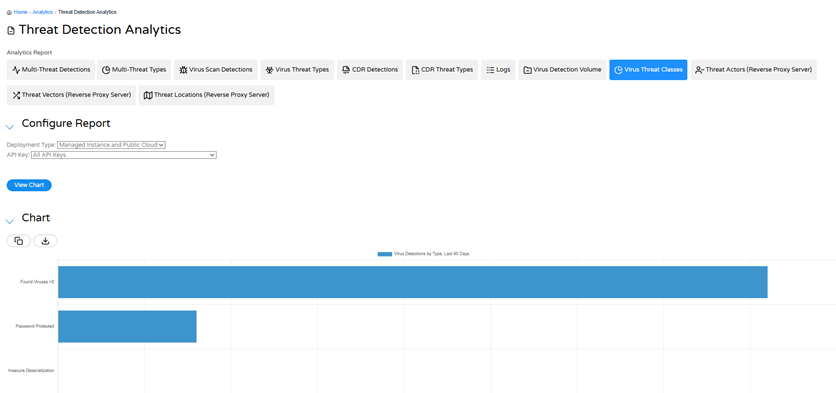
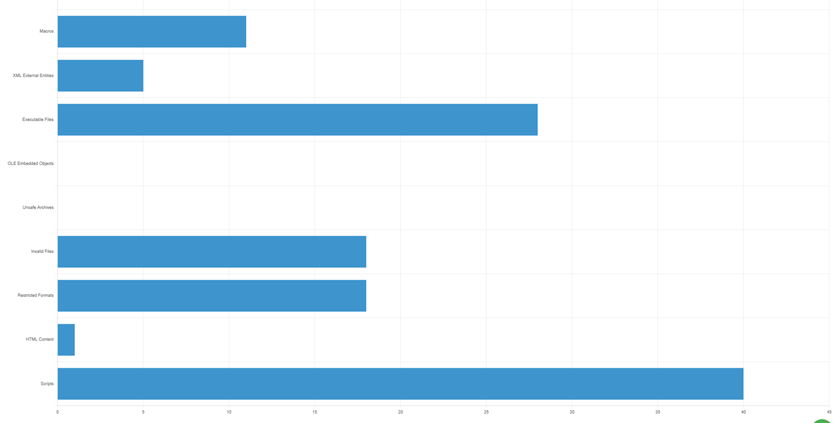
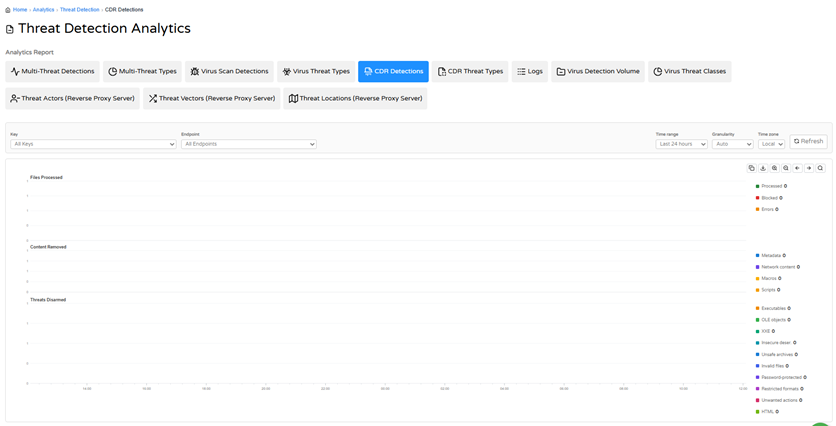
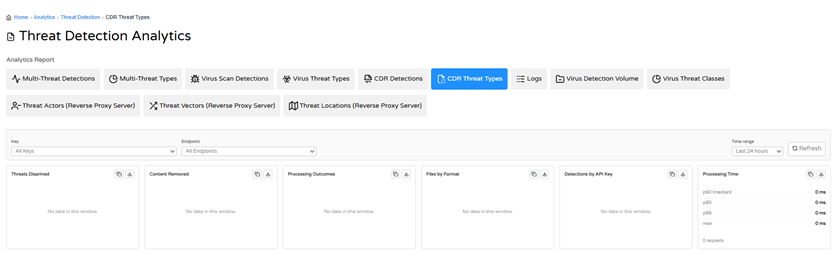
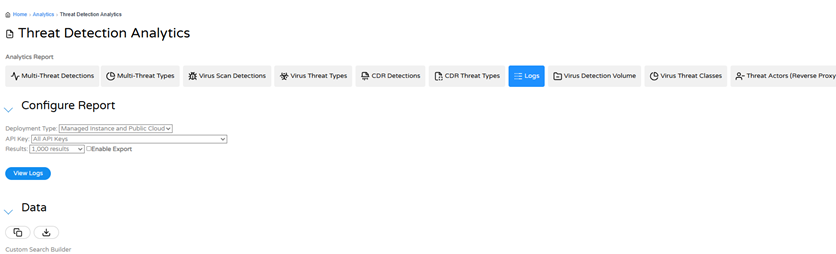
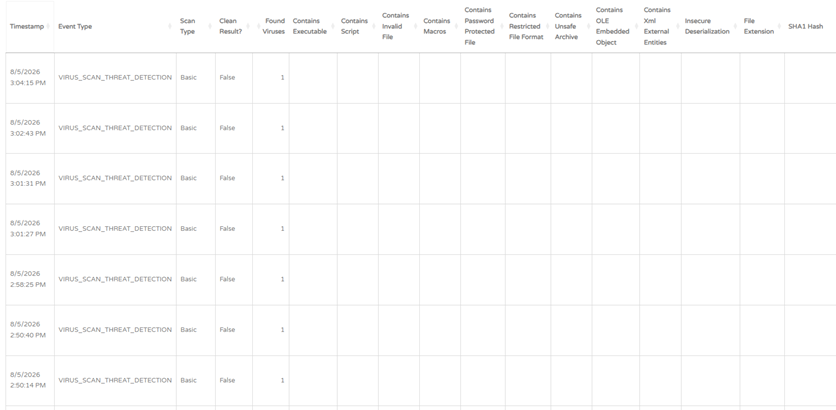
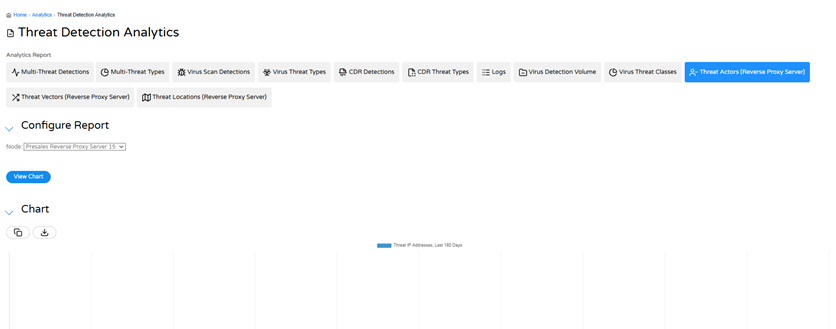
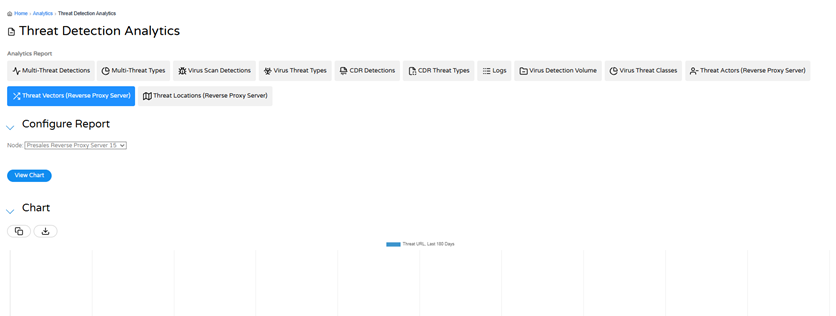
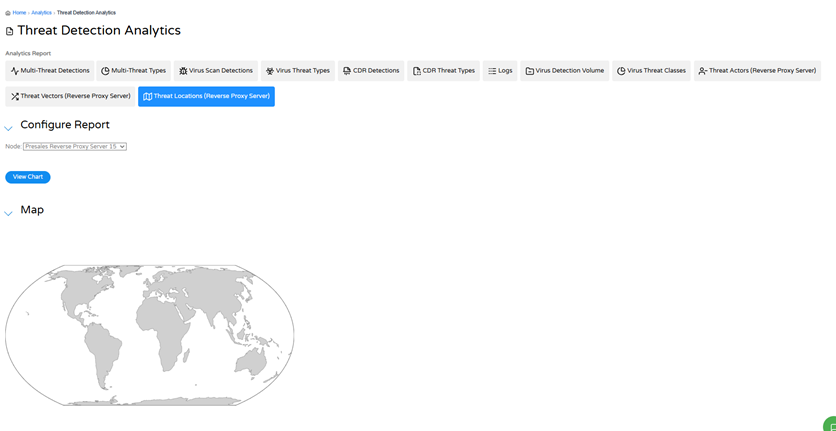
Threat detection doesn’t end when a risky piece of content is identified. Security teams also need a clear way to get answers: what is being detected? Where is that activity coming from? How are those patterns changing over time? Cloudmersive Threat Detection Analytics brings that visibility into the Cloudmersive Management Portal. In one comprehensive reporting experience, teams can examine activity across Multi-Threat Detection, Virus Scanning, Content Disarm and Reconstruction (CDR), and Reverse Proxy Server deployments. High-level charts make broader detection trends easy to recognize, while searchable detection records and logs support deeper investigation when it’s needed. In this tour, we'll walk through all the major groups of Threat Detection Analytics reports and the important questions each group can help answer. Accessing Threat Detection AnalyticsThe Management Portal's The Threat Detection Analytics experience is organized sensibly into related report families. Most reports can be scoped using controls such as API key, endpoint, deployment, time range, granularity, or time zone. This makes it possible to begin with an account-wide view and gradually narrow the report to the activity most relevant to a particular application or environment. Charts and data views also include practical options for refreshing, copying, downloading, searching, and adjusting the visible data. Rather than requiring teams to work from a single fixed dashboard, the portal supports both quick review and more focused analysis. Understanding activity across Multi-Threat DetectionCloudmersive Multi-Threat Detection evaluates content across a variety of complementary security categories. Its analytics reports reflect that broader scope, helping teams understand both overall scanning activity and the types of risks appearing within it. The This structure allows a security team to recognize a change in overall threat activity without losing sight of what caused it to begin with. For example, a rise in threat detections might be associated with malware, phishing content, sensitive-data exposure, or some other enabled detection layer. The report provides the context needed to distinguish between those detections. The detection table beneath the chart supports the next level of investigation. Teams can narrow results in several ways, including by threat class, subtype, result, time range, filename, or hash, then review details such as the affected file or object, its source, and the detected threat class. Advanced search, configurable columns, grouping, and export controls make the same data easier to adapt for investigation or reporting workflows. The companion Together, these two reports answer two different (but closely related) questions: when is threat activity changing, and what kinds of content are driving that change? That distinction helps teams move from broader monitoring into more informed review. Examining Virus Scan activity and malware patternsThe Virus Scan reports provide a more focused view of malware detections and suspicious file characteristics. They bring together time-based activity, individual detection records, common virus types, scan volume, and the broader classes of content encountered during scanning. The Below the chart, the detections table provides a searchable record of individual events (note that this is available on most of the reporting pages, but not all screenshots reflect this). A team can move from a visible change in the timeline to the files, scan types, threats, virus names, and hashes associated with that activity. The This view is especially useful when the goal is threat comparison rather than threat investigation. It can help reveal whether detections are concentrated around some particular malware family, scanning method, or application represented by a Cloudmersive API key. For longer-term monitoring, the The resulting timeline makes it easy to see unusual spikes. A sudden increase might warrant investigation into a new upload source, some change in traffic, a targeted campaign, or another event occurring during the same period. The Categories like scripts, executable files, macros, XML external entities, invalid files, password protection, and restricted formats provide a broader picture of the content reaching an environment. These indicators are not all equivalent to a named malware detection, but they can certainly help expose recurring risk patterns, and they can help teams evaluate whether their current handling policies match the content they receive. Reviewing Content Disarm and Reconstruction resultsContent Disarm and Reconstruction takes a slightly different approach to file security. Rather than relying only on a malicious-or-clean decision, CDR processes supported files to remove and/or neutralize potentially dangerous active content while preserving a safe result. The This gives teams a practical view of how often reconstruction is being used and what exactly it’s removing. Activity involving metadata, network content, macros, scripts, executables, embedded objects, XML external entities, insecure deserialization, unsafe archives, and other restricted content can be viewed within the same report. The Together, the CDR reports help answer whether files are being reconstructed successfully, which active-content risks appear most often during that process, and whether processing behavior differs across file types or applications. That supports security review and routine service monitoring without forcing teams to inspect every reconstructed file independently. Moving from trends into detailed logsCharts are great for identifying patterns, but investigations still require information on the individual events behind them. The Logs report provides that more detailed layer. Teams can configure this report by deployment type, API key, and result count. An export option and custom search builder support larger reviews or more targeted queries when a general log view is not enough. The resulting table records the time and type of each event, its scan mode and clean result, and the threat or content indicators associated with it. Depending on the event, this can include found viruses or flags for executables, scripts, macros, password-protected files, restricted formats, unsafe archives, embedded objects, XML external entities, insecure deserialization, and other file characteristics. This is where the broader reports become actionable evidence. A team can identify an unusual period or category in a chart, then use the logs to understand which requests and results contributed to it. The goal is not necessarily to read every event manually; rather, it’s to make detailed records available when a pattern needs explanation. Mapping Reverse Proxy Server threatsFor Cloudmersive Reverse Proxy Server deployments, Threat Detection Analytics adds context around the actors and paths involved in hostile activity. Three complementary reports organize that information by threat actor, threat vector, and geographic location. The The The Viewed together, these reports help teams build a more complete picture of activity reaching a protected application: where it came from, which source was involved, and what route it targeted. This context supports investigation, infrastructure review, and decisions about how Reverse Proxy Server protections should be configured. Turn detection data into operational visibilityCloudmersive Threat Detection Analytics brings several layers of security reporting into one user-friendly Management Portal experience. Teams can begin with broad activity across Multi-Threat Detection, examine malware-specific patterns, review CDR outcomes, investigate individual events, and map threats observed by Reverse Proxy Server deployments. The analytics themselves provide visibility rather than enforcement. They show what Cloudmersive security APIs are encountering and how that activity changes, giving teams stronger evidence for policy adjustments, application review, incident response, and ongoing security reporting. To explore these reports, log in to the Cloudmersive Management Portal and open |
Sign Up Now or 

 Blog
Blog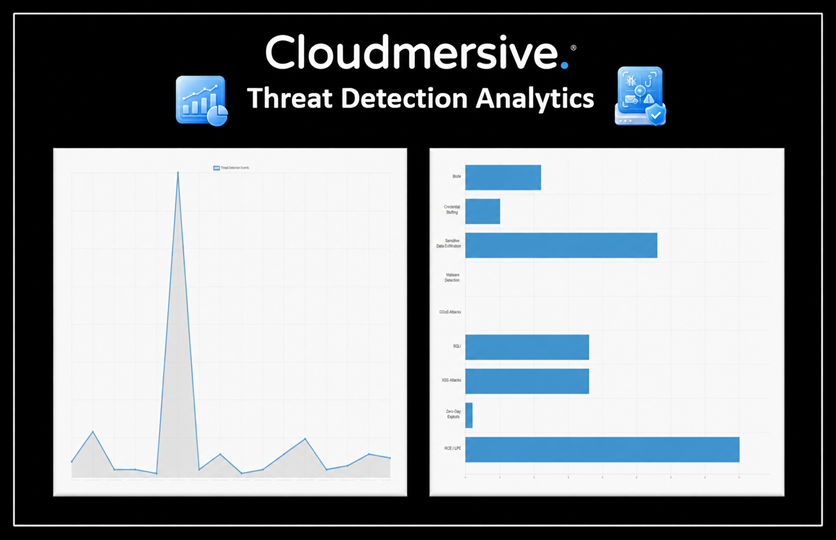
 Virus Scan APIs
 Content Disarm and Reconstruction APIs
 Spam Detection APIs
 Document Conversion & Processing APIs
 Document AI APIs
 Natural Language Processing (NLP) APIs
 Optical Character Recognition (OCR) APIs
 Image and Face Recognition and Processing APIs